What Are LUFS? The Complete Guide
Discover the importance of LUFS (loudness units full scale) in the mixing and mastering process and how you can use them to create music that meets the delivery specifications of major streaming and TV platforms.
It’s hard to talk about music production in the ‘20s without the topic of LUFS and loudness coming up. But what is the definition of LUFS? What makes them different from other types of level meters? And why are they even important?
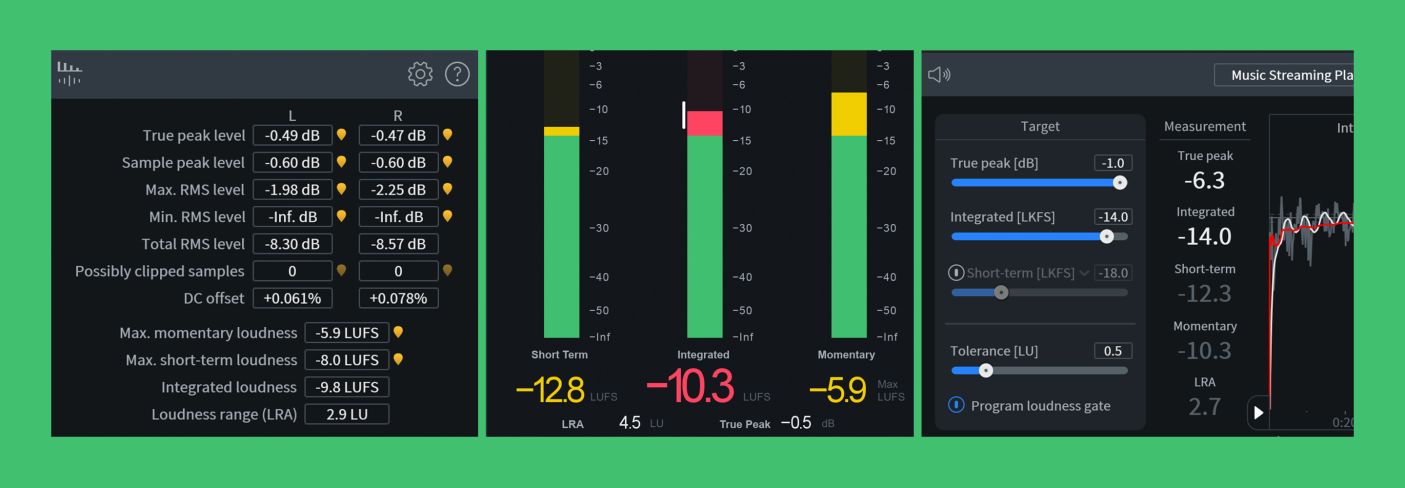
In this article, we’ll unpack all that and more, and by the end, you’ll have a solid LUFS definition and understand how to interpret all five metrics—momentary, short-term, and integrated loudness, LRA, and true peak—shown on an LUFS meter like Insight. You’ll also have a firm grip on why LUFS measurements are important in modern music production and how to utilize them.
Follow along with iZotope


Insight 2
What are LUFS?
LUFS stands for loudness units full scale. If you’ve heard of dBFS before, that “full scale” bit may sound familiar, and in fact, it’s integrally related here. Just as dBFS are decibels relative to full scale—where “full scale” is the highest level allowable in fixed-point digital audio—LUFS are loudness units relative to full scale.
This rather inevitably leads to the question: “what is a loudness unit, or LU?” In the simplest terms, loudness units are the same as decibels, with one key difference: they attempt to factor in the ways in which our ear-brain system interprets loudness based on the tonal balance of a sound. The upshot is that if you take a sound or mix and just turn it up by 3 dB, its LUFS readings will also increase by 3 LU. However, if you apply EQ to a sound or mix without changing the level, the LUFS value may also change depending on how you EQ it.
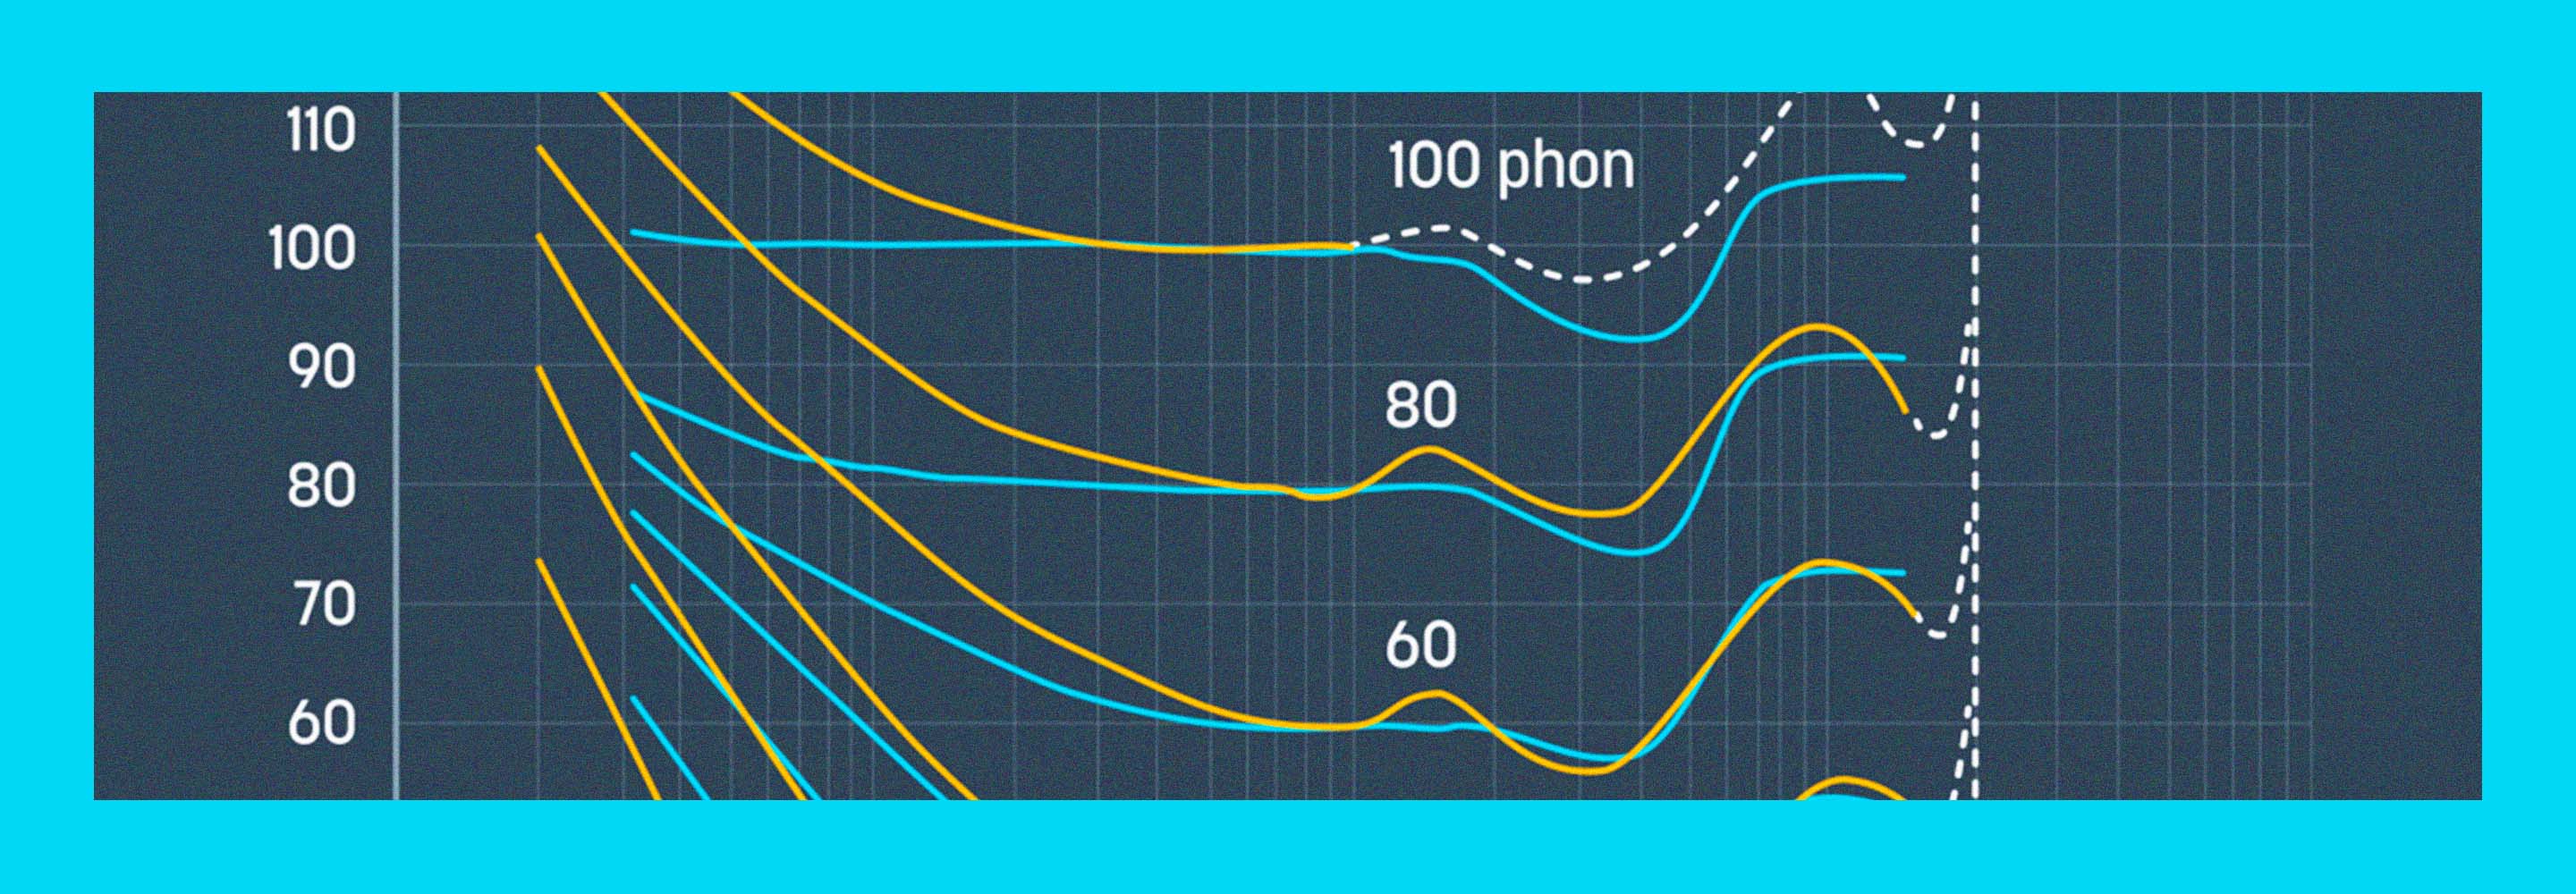
Let’s talk briefly about the basic way in which LUFS values are measured and then take a look at the five specific metrics. The first step in calculating LUFS is to apply what’s known as a K-weighting filter to the incoming audio. In simple terms, this applies a 4 dB high-shelf above about 2 kHz as well as a 12dB/oct high pass filter at 100 Hz. This simulates the fact that we tend to be more sensitive to high frequencies and less sensitive to low ones in our perception of loudness.
After this K-weighting filter is applied to the audio, its R.M.S. level is calculated and the resulting values are used for the first three of our five main metrics: momentary, short-term, and integrated loudness. Let’s dig into those now.

iZotope Insight metering
Momentary loudness
Momentary loudness is the basis for both short-term and integrated measurements and is essentially just an R.M.S. meter like you might be accustomed to from your audio workstation or other older “traditional” meters.
That said, it has two factors that set it apart. First, it’s measuring the K-weighted, filtered audio—as previously described. This means that it’s less sensitive to very low frequencies and slightly more sensitive to high ones. This solves two problems that notoriously plagued standard R.M.S. and VU meters—oversensitivity to bass and lack of sensitivity to treble.
Second, it has a specific measurement window, sometimes called an integration time. Another problem with standard R.M.S. meters is that if you measure the R.M.S. value of a 50 ms chunk of audio, you will get a very different value than if you measure a 500 ms chunk. This means that two R.M.S. meters can read very differently depending on their measurement windows.
Momentary loudness solves this by specifying a 400 ms window and additionally stipulating that each measurement window should overlap the previous one by 75%. This ensures that you get nice, smooth readings out of the meter, and also that all momentary meters read identically.
Short-term loudness
Short-term loudness builds on the output of the momentary meter and shows a moving average of the last three seconds of momentary values. This provides a meter that moves more slowly and smoothes out some of the peaks and troughs in loudness that the momentary meter will pick up. Because of this, it also tends to ready slightly lower than a momentary meter.
Integrated loudness
Integrated loudness is to short-term loudness as short-term is to momentary. In other words, it takes the short-term reading and averages it over the duration of an entire “program.” Normally this can mean a song, a TV commercial, an entire TV episode, or even a full feature film, and in effect, it can tell you the total average loudness of the entire piece of audio.
Most meters will reset every time you stop and start playback, but some—like Insight—can hold the loudness calculations and resume them when the transport is restarted—green button at the top next to the settings cog, above. This can be useful, but it can also give you an inflated value if you’re playing the loudest chorus over and over. To get a true integrated value you’ll want to either play your song all the way through or use something like the Waveform Statistics window in RX.
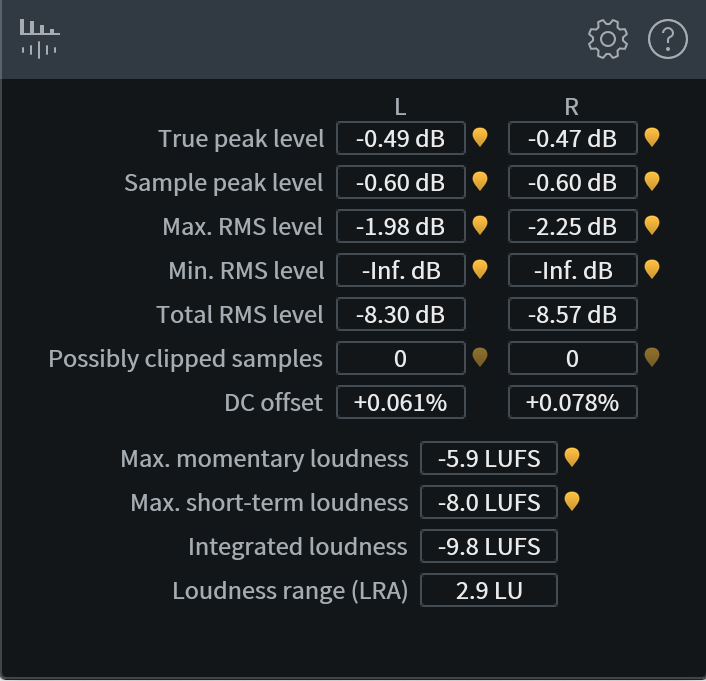
iZotope RX Waveform Statistics
One final detail of integrated loudness is that it uses two gates. The first is at -70 LUFS. This means that any levels below -70 LUFS will not contribute to the integrated measurement value. The second is a so-called “floating” gate 10 LU below the current integrated level. This means that once the integrated measurement gets going, any sections that are more than 10 LU quieter will also not contribute to the overall measurement.
LRA
Loudness Range—or LRA—is the most complicated metric to describe and involves statistics, vector arrays, more floating gates, and so on. We’re not going to go into depth here, but as a thought exercise, start by imagining plotting all your momentary measurements from quietest to loudest—where repeated measurements of a particular loudness value create a higher peak on the graph. Next, imagine finding the area in the middle of the graph where about 50% of your most frequent loudness readings live.
LRA is described by the difference between the top and bottom of that range—shown as the darker blue 50% below, and indicated in Insight by the “LRA” value at the bottom, as well as the white bar on the left side of the integrated level meter.

Simplified loudness distribution
If that feels a little abstract, I can’t blame you—it is. In essence, though, it’s telling you the LU range over which the majority of your loudness hangs out. Any moments that are louder or softer and happen outside that range occur less than about 25% of the time, each.
Since that’s still pretty abstract, let’s think about a few examples. Imagine a song with an LRA of 3 LU. That means that about 50% of the song is within 3 LU, in other words, it has a very consistent level. On the other hand, imagine a feature film with an LRA of 25 LU. This means the film has lots of what we might call macro-dynamics, with plenty of soft dialog and probably some loud action sequences too.
True peak
True peak is the last of our five main metrics on an LUFS meter and aims to show the peak level that will actually come out of a digital-to-analog converter. You might think, “wait, why is this different than the normal peak level shown in my digital audio workstation?” Good question!
Most meters in an audio workstation show what’s known as the sample peak level. In other words, it’s the highest instantaneous level that the digital audio samples have. One of the oddities of digital audio, though, is that the actual analog voltage that comes out of a digital-to-analog converter can be higher than the sample levels on either side of it.
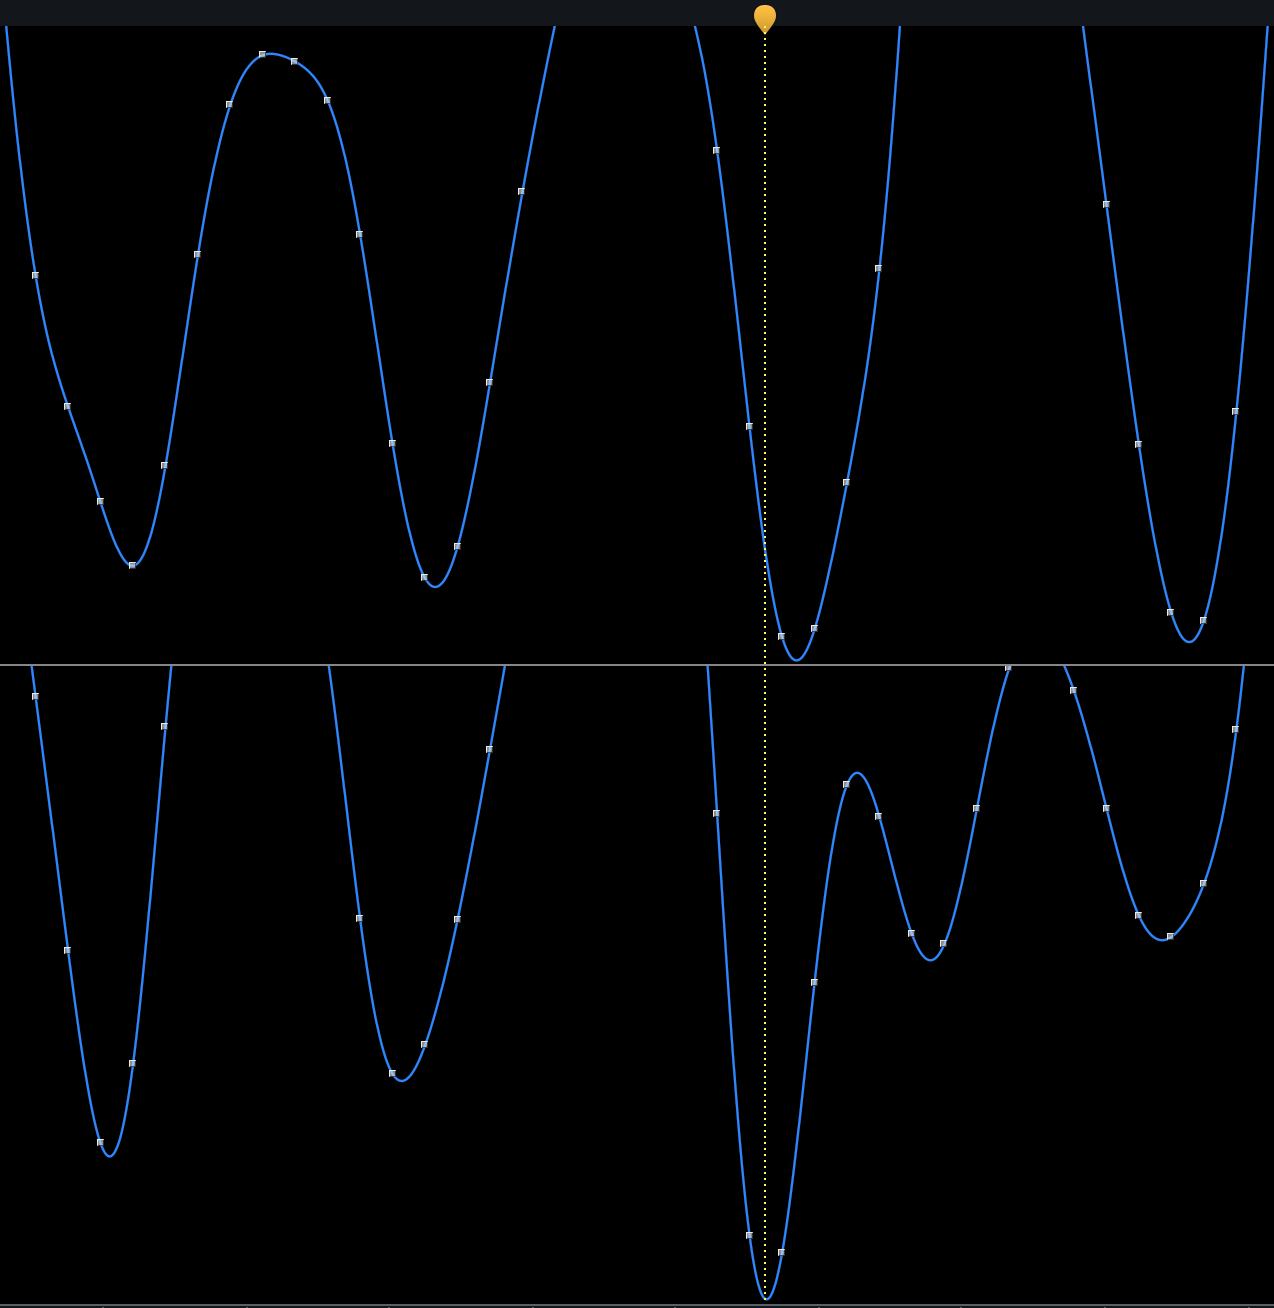
True peaks (blue line) vs. sample peaks (white dots) in RX
True peak measurements attempt to predict this actual analog level by “oversampling” the audio. Oversampling means that the sampling frequency is increased—in the case of true peak, by a factor of four—and the new sample points more accurately reflect the analog level that will ultimately be produced. This is helpful to avoid unintentionally clipping the output of either your converter or, more likely, a converter in a consumer playback device.
Additional reading for the inquisitive-minded
If you really want to geek out on this stuff and get into the weeds, you can take a look at ITU recommendation BS.1770-4, along with EBU tech docs 3341 and 3342.
Why are LUFS important?
LUFS have become a de-facto standard for measuring audio loudness on many delivery platforms. In some cases—like audio for TV and film on Netflix, Amazon, etc. or Dolby Atmos mixes—the audio needs to be delivered in a way that meets certain specifications, whether they be integrated loudness, true peak, LRA, or some combination.
The other major use case is loudness normalization on music streaming platforms. While you certainly don’t need to master your music to the normalization reference levels used by Spotify, Apple, Amazon, Tidal, and others, it is very helpful to understand what those levels are and how your music will sound when played back accordingly.
While it’s true that LUFS attempts to measure perceived loudness, and theoretically two songs that both measure as -14 LUFS integrated should sound identically loud, that’s often not quite the case in practice. They will likely be very close, but differences in arrangement, mixing, and mastering can result in small but noticeable differences in perceived loudness.
For that reason, it may be a good idea to audition your mix or master at some common normalization reference levels and compare it to your favorite reference tracks on a streaming platform that uses that reference level. Let’s look at some examples.
How to use LUFS in mixing and mastering
An LUFS meter, like Insight, can be very handy during both mixing and mastering. If you have a secondary monitor, you might even consider keeping it open permanently so you can always glance over to get a quick idea of where your levels are. However, which metrics you look at, and the value ranges you might expect to see them in will vary depending on whether you’re mixing or mastering.
Using LUFS in mixing
One of the perennially tough parts about mixing is figuring out what levels to use for the very first elements you bring into the mix. There are a few techniques you can use to help with this. One is to use a calibrated monitor gain, which often allows you to work by ear. Another is to use Mix Assistant in Neutron which can help you get a good starting balance while leaving enough headroom.
However, if you want to put your LUFS meter to good use, there are a few ways it can help you too. First, you could just dial up a very rough, quick, level balance. Nothing you need to get attached to, just something roughly in the ballpark, or maybe one of the parking lots outside the ballpark. If your master out is clipping at this point, don’t even worry about it (the only time you’ll hear me say that!).
Then, open your LUFS meter, select all your mix faders, and pull them down until your short-term level is hovering around -20 to -18 LUFS. From there, pull all your faders down to -inf—I told you not to get attached!—except maybe the bass, or lead vocal. At this point, you can start building your mix in earnest around that one key element and you should find you have plenty of headroom.
Once you have a rough mix you’re happy with, try soloing a few key elements like the lead vocal or instrument, bass, kick and snare drums, or other important mix elements, and make a note of their momentary loudness values. This will be very mix- and genre-dependent, which is why I’m not giving you specific values, but on future mixes, you can shortcut the process and start by getting your key elements in those loudness ranges that you know work well as starting points for you.
At the mix stage, you don’t need to worry too much about integrated or true peak levels, but it is worth keeping an eye on LRA. If you use the guidelines I’ve laid out above—short-term levels in the -20 to -18 LUFS range—you’ll probably end up with an integrated level in the -24 to -20 LUFS range, and plenty of peak headroom above your loudest true peak level.
However, if you end up with a very low—say less than 3 LU—or very high—say more than 15 LU—LRA, you may want to take a look at some of your arrangement or automation decisions. Low LRA isn’t necessarily a problem, but it may indicate a missed opportunity to craft a more dynamic and engaging mix. Conversely, high LRA can be an early indicator that it may be challenging to create a master that will work well on streaming.
For a border overview of metering in mixing, check out this article on metering. All that said, you should never let numbers dictate your art!
Using LUFS in mastering
With LUFS for mastering, things are a little different. Not that you should let numbers dictate what you do here either, but understanding how a master will work in the world of streaming is part of the job. Accordingly, there are a few numbers it’s worth keeping an eye on.
True Peak level
Some streaming services recommend maximum true peak levels of no greater than -1 or even -2 dBTP. This is important for lossy streaming services like Spotify and Soundcloud because lossy codecs often cause the peak level of the file to overshoot its corresponding value in the lossless file, which could result in clipping.
However, as more and more services support lossless streaming, leaving true peak headroom is becoming less of a factor. Personally, I usually aim to keep my true peaks below -0.3 dBTP or so, but opinions on this are wide and varied.
Integrated level
What your final integrated level is is less important than understanding that on most streaming services it will be reduced to about -14 LUFS, however it won’t always be turned up to -14 LUFS. This means that:
- A) you probably want your integrated level to be at least a little bit above -14 LUFS
- B) having it too far above -14 LUFS means you could be unnecessarily sacrificing punch and micro-dynamics, although maybe that helps you achieve the sound you’re after, and…
- C) it’s probably worth listening to your final master at -14 LUFS integrated to see how it compares to reference tracks on your favorite streaming platform. The easiest way I know of to do this is to open your master in RX, open the Loudness Control module, and run the Music Streaming Playback Check preset.
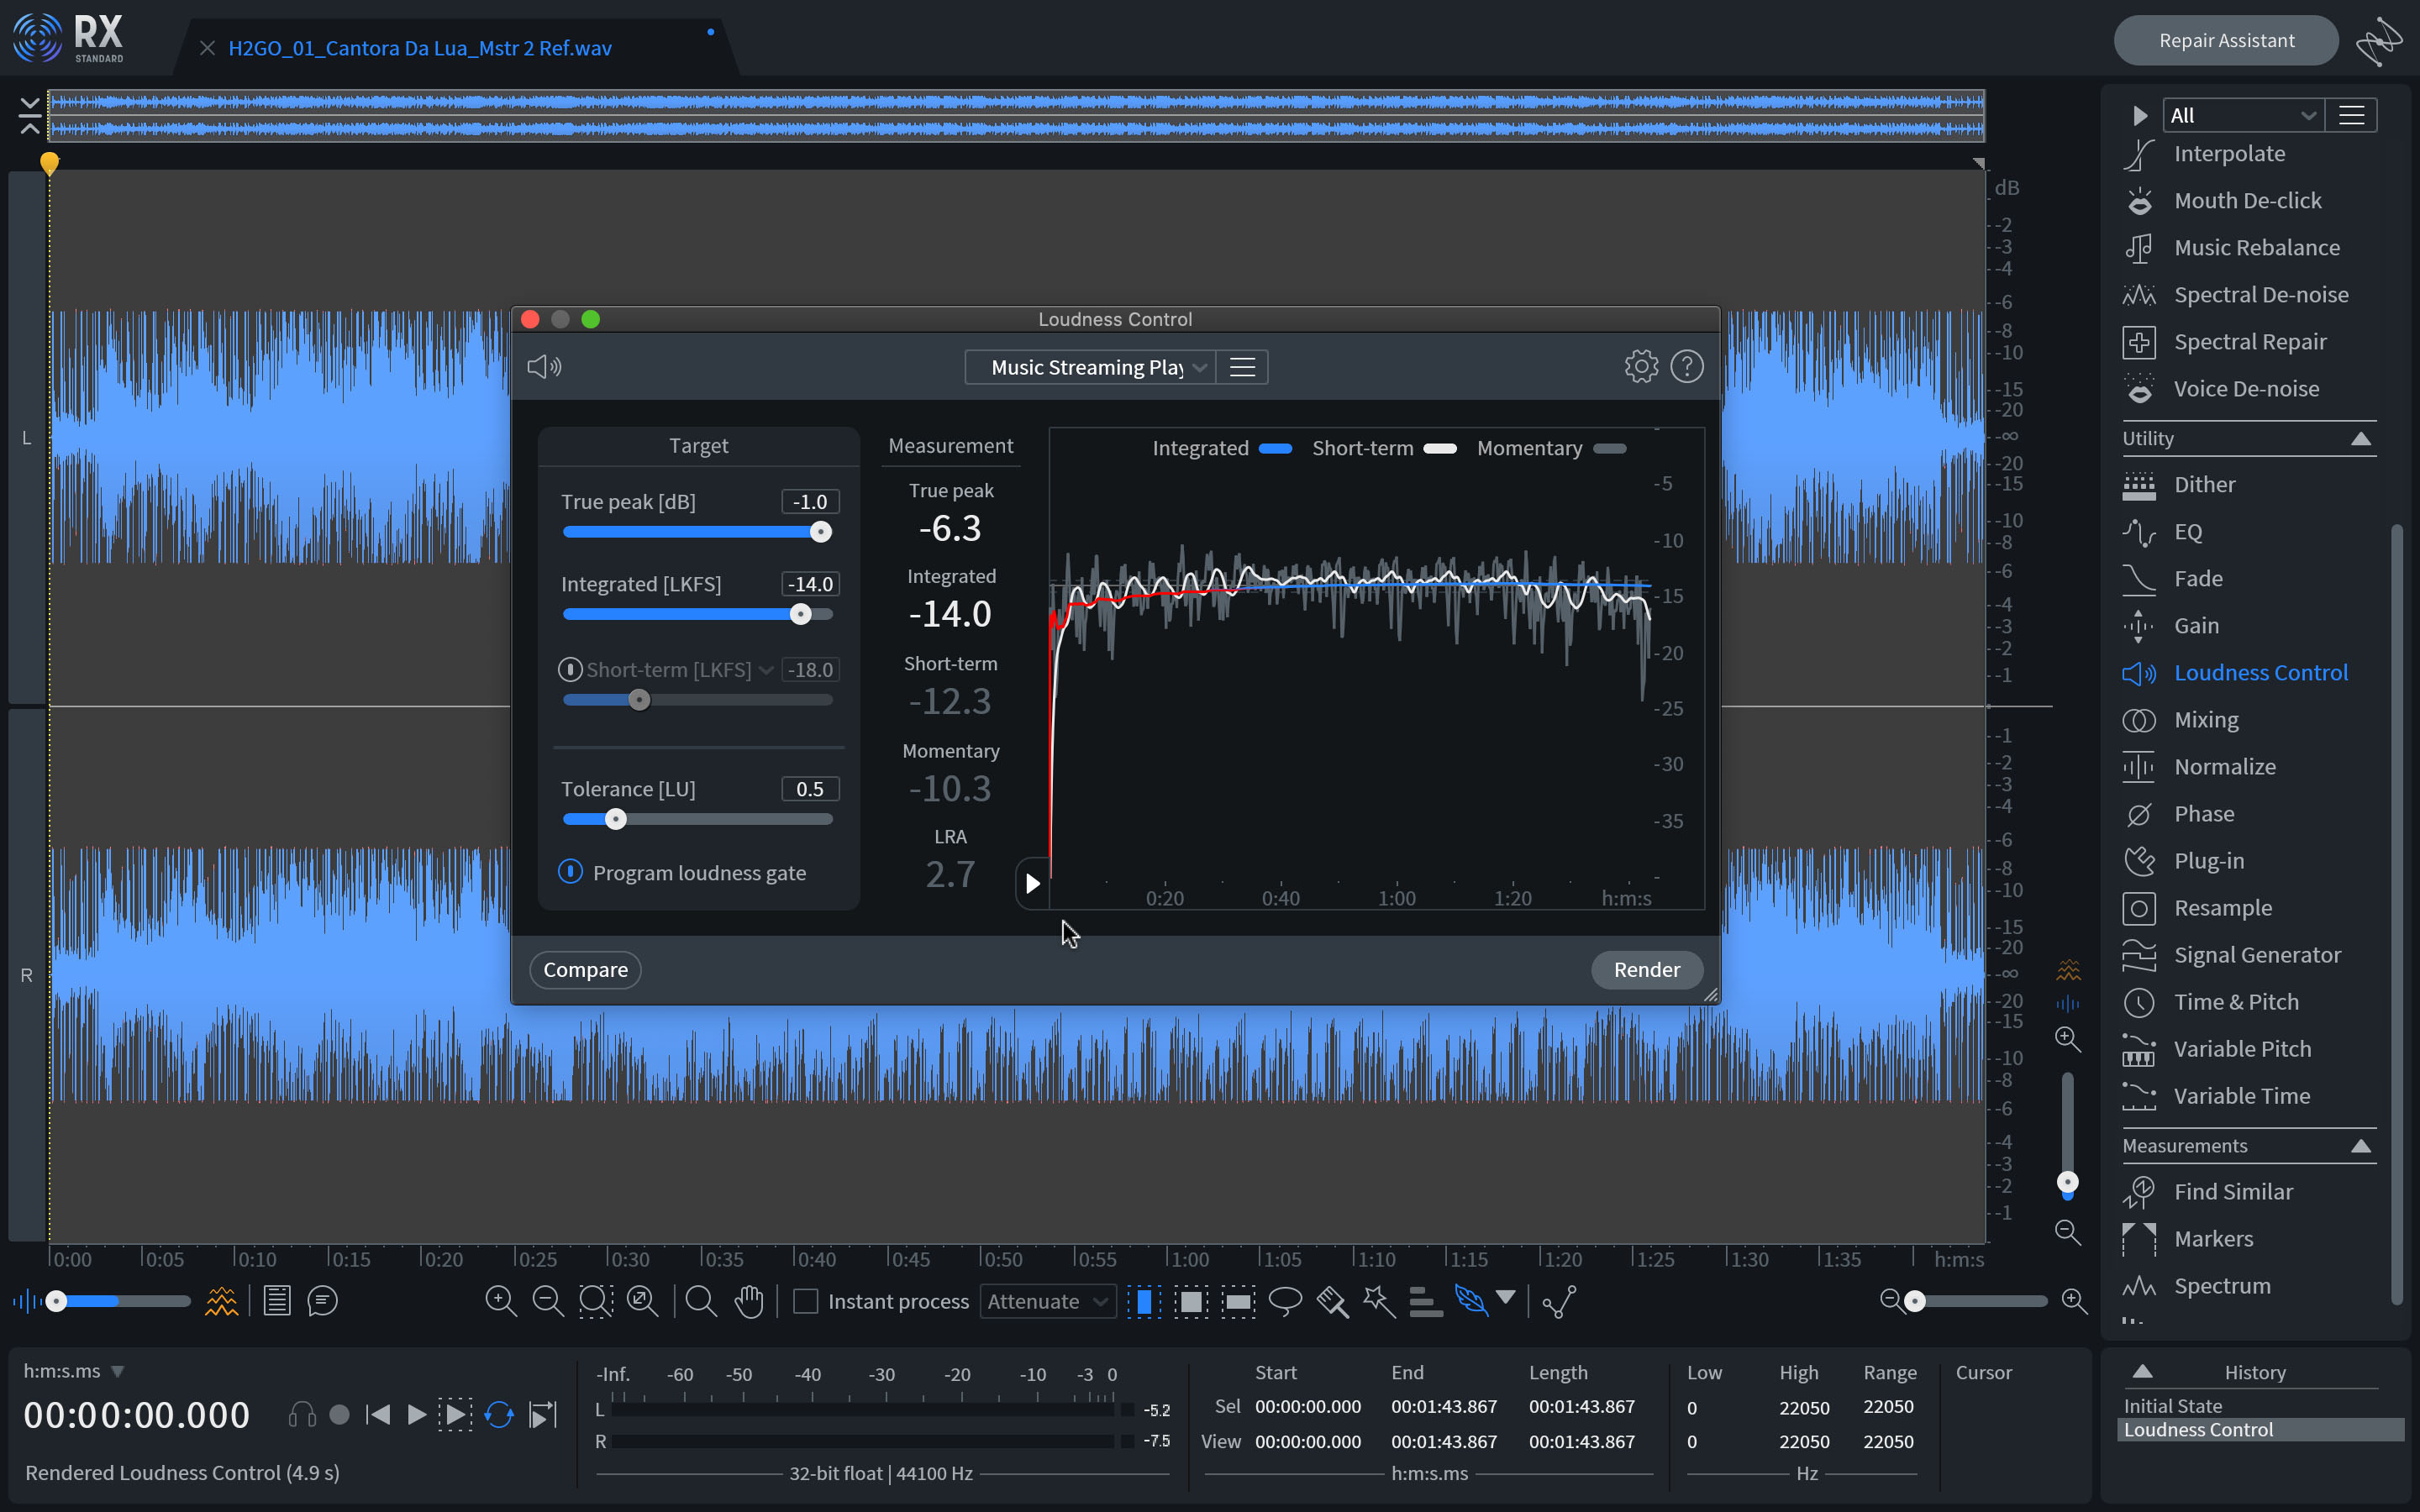
RX Loudness Control for streaming
Short-term level
Again, specific short-term levels aren’t especially important, but if your maximum short-term loudness is less than about 6 LU below your true peak level, that could again be an indication that you’re pushing things further than you need to.
Start using LUFS in audio production
So, at this point, you should have a good understanding of the five metrics a modern LUFS meter will show you—momentary, short-term, and integrated loudness, as well as LRA and true peak—and also how those metrics are calculated. Furthermore, you should have a solid grasp of why they’re applicable in modern music production, and how to use them while mixing and mastering.
However, there’s something I’ve alluded to a few times that bears repeating: don’t let the numbers make decisions for you! Ultimately, this is an art and we need to use our ears. The numbers can be a helpful reference and give us an indication of what to listen for, and specific spots to listen for it, but they should never be the end-all and be-all.
To quote the great Tony “Jack the Bear” Mantz, “This is no luffing matter!” Good luck, and happy metering!


