What is the Fletcher Munson Curve? Using Equal Loudness Curves in Mixing and Mastering
What are the Fletcher Munson curves, or equal-loudness contours, and how do they apply to audio mixing or mastering? This article will cover that all in detail.
“Fletcher Munson,” or “equal loudness” are the kinds of terms experienced audio engineers will throw around with the forgone conclusion that everyone must know what they’re talking about. However, the concept of equal loudness is hardly a simple one, and if you just look up “Fletcher-Munson curve” and examine the graphs that appear, you’ll probably walk away more confused than when you started.
There’s no need to get bent—or curved—out of shape though. In this article, we’ll define what the Fletcher Munson curves and equal loudness contours are, work out how to read and interpret them, and apply that new knowledge to our practice of audio production, mixing, and mastering.
Jump to these sections:
- What are the Fletcher Munson and equal loudness curves?
- How to read and interpret equal loudness contours
- How to use equal loudness concepts in mixing and mastering
Follow along with this tutorial by applying equal loudness concepts in your sessions with Tonal Balance Control.
What are the Fletcher Munson and equal loudness curves?
The Fletcher Munson curves are a set of experimentally determined graphs that show how loud—in dB SPL—a sound at one frequency must be in order to be perceived as equally loud as a sound at another frequency. In other words, if I play a 1,000 Hz tone at 80 dB SPL, how loud must I play 100 Hz, 10 kHz, or any other frequency in order for it to sound equally as loud as the 1,000 Hz tone? And what if I start with the 1,000 Hz tone at 40 dB SPL rather than 80?
These were some of the questions Harvey Fletcher and Wilden A. Munson set out to answer in the early 1930s, and in 1933 they published their results in a paper entitled, “Loudness, its definition, measurement and calculation.” One of their most well-known and longest-lasting contributions from that paper is “Fig. 4 Loudness level contours.”

The original Fletcher-Munson loudness level contours
We’ll get into how to interpret these contours, and some of the complexities behind creating them shortly, but first it’s worth mentioning that although it’s still common to cite Fletcher and Munson when discussing equal loudness, their original work is now nearly 90 years old, and can hardly be said to be state of the art anymore.
Bringing equal loudness into the 21st century
In the better part of the century since Fletcher and Munson’s original work, there have been numerous other studies aimed at taking similar measurements. Believe it or not, since 1961 the ISO has published standard 226 as the benchmark for equal loudness contours. The last revision was published in 2003 based on research in Japan, Germany, Denmark, the UK, and the US, and there is currently a subsequent revision under development.
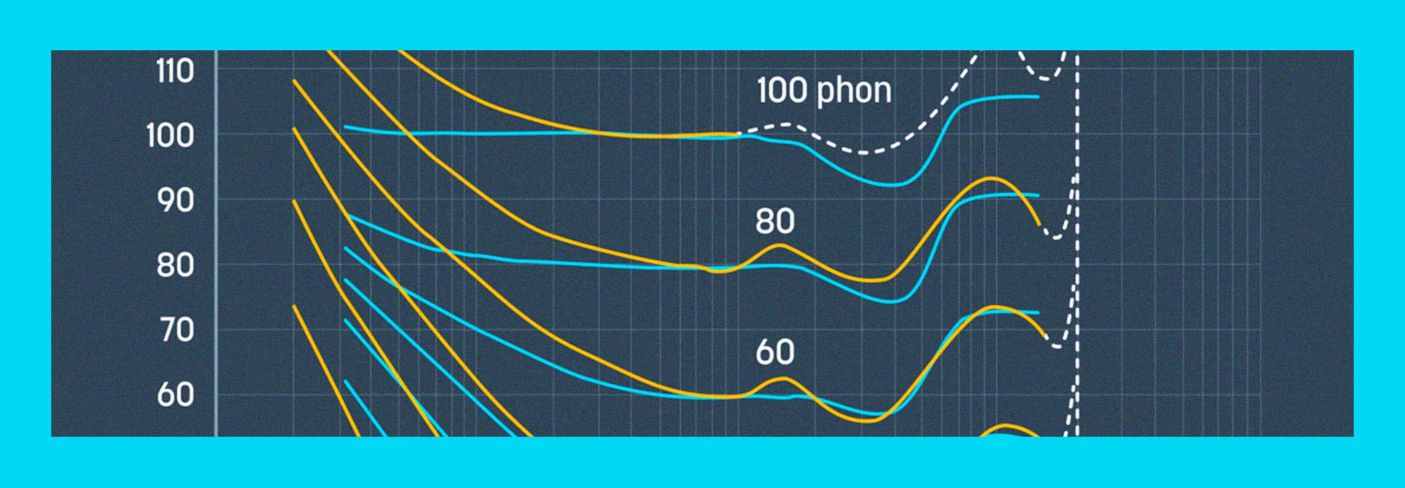
While this doesn’t change any of the fundamental concepts behind the original Fletcher Munson equal loudness contours, it does help refine our understanding of the human perception of pitch and loudness. Here are the contours from the 2003 revision of ISO 226 in red, with the original Fletcher-Munson curves underlaid in blue for comparison.

ISO 226:2003 and Fletcher-Munson contours, compared
How to read and interpret equal loudness contours
Ok, so what are those squiggly lines in the equal loudness contours actually telling us? Well, one of the first things to notice is the labels above them, particularly that one that says “100 phon.” What is a phon? A phon is a unit of perceived loudness, which is a fun way of saying “a way to measure something that is entirely subjective.”
Specifically though, a 1 kHz tone at 70 dB SPL is 70 phons. A 1 kHz tone at 105 dB SPL—ouch!—is 105 phons. Some arbitrary sound that sounds as loud—to you—as a 1 kHz tone at 83 dB SPL, is 83 phons. If we apply this back to the equal loudness contours, it means that the 80 phon line shows us how many dB SPL—y-axis—are necessary to achieve 80 phons at any given frequency—x-axis.
Let’s examine the 80 phon line in a little more detail.

First, notice that at 1,000 Hz, the 80 phon line aligns with 80 dB SPL. That aligns with our definition of phons—so far, so good. What if we go down to 100 Hz? Now our 80 phon line is closer to 90 dB SPL. This tells us that in order for 100 Hz to sound as loud as 1,000 Hz at 80 dB SPL, it would have to be played at about 90 dB SPL. In other words, our ears are less sensitive to 100 Hz. What about the dip around 3–4 kHz? That tells us our ears are more sensitive in that region, and a lower SPL would sound equally loud.
Another interesting fact to point out is that although the shape of each curve is similar at different phon levels, the deviation increases noticeably. For example, at 20 phons, 100 Hz would have to play at nearly 45 dB SPL to sound as loud as 1 kHz at 20 dB SPL. That’s a 25 dB increase, compared to the roughly 10 dB increase needed at 80 phons. What’s more, the dip at 3–4 kHz is a good 5–6 dB, compared to the 2–3 dB at 80 phons.
And this is one of the key points, which leads us to…
How to use equal loudness curves in mixing and mastering
Arguably the main takeaway here is that our perception of tonal balance is dependent on the sound pressure level at which we are listening. In other words, how we set our monitor gain can affect our EQ and mix balance decisions. That’s huge, and it’s important to understand and keep in mind, but, there are some giant, elephant-sized caveats in the room here.
First and foremost, the equal loudness contours are created by averaging the data taken from thousands of people. Furthermore, those people may or may not be skilled, trained listeners, and are being asked to complete an inherently subjective task. Have you ever tried setting a 50 Hz and 1,000 Hz tone to the same perceived loudness? What does that actually even mean? It’s a question with either many or no right answers.
And there’s the rub. The ISO 206:2003 equal loudness contours give us some great data about the general ways in which we humans perceive different frequencies at different sound pressure levels, but they don’t actually tell you anything about you, or your client, or your roommate or girlfriend, and definitely not your cat.
When you first learn about equal loudness contours, it can be tempting to over-intellectualize them, trying to create inverse EQ curves to apply to your mixes. I implore you to resist that urge. Instead, try to keep the big picture in mind.
If you’re working at a lower SPL—and there’s nothing wrong with that!—just remember that you’ll be less sensitive to very low and high frequencies, so resist the urge to over-EQ them, or mix them too loud. And if you’re mastering, get in the habit of having a calibrated monitor gain you can return to with ease. If you’re using reference tracks—whether during mixing or mastering—be sure to loudness match them to your song.
Start using equal loudness curves in your music
Really, you’ve been using and adapting to equal loudness contours your whole life, and that’s important to remember too. This is one of those concepts that’s certainly important and useful to understand, as it can help explain some of our experiences and missteps, and allow us to do better work in the future. However, it’s almost equally as important to forget about it, or at the very least put it on the back burner.
Ultimately, your ear-brain system knows what things should sound like at different sound pressure levels. It’s just easy to overthink and override what they may be trying to tell you. So learn the lessons of equal loudness, file them away, and if you ever need help nailing your tonal balance, Tonal Balance Control is a much better way to do that than trying to cook up your own inverse equal loudness curves. Good luck, and happy balancing!


