Understanding spectrograms
What is a spectrogram and how do they work? Learn how to read a spectrogram and begin understanding important information about your audio.
There are countless audio analyzers out there that tell us information about the audio we're working with from peak volume and dynamic range to stereo spread and more. The one thing most of these tools have in common is that they provide this information to us in a visual way, sometimes with numbers and sometimes with graphs.
Spectrograms are one of these tools. What are spectrograms and what kinds of information do they tell us? Read on to find out!
Follow along with this tutorial using iZotope RX 11.
What is a spectrogram?
Spectrograms are visual representations of audio – representing time, frequency, and amplitude all on one graph. They visually reveal audio problems by sight, like broadband, electrical, or intermittent noise, which can help us make decisions with mixing music or editing sound. Because of its profound level of detail, a spectrogram is particularly useful in post production – so it’s not surprising that you’ll find one in tools like iZotope Insight and RX.
Spectrogram vs. waveform
In audio software, we’re accustomed to seeing a waveform that displays changes in a signal’s amplitude over time. A spectrogram, however, displays changes in the frequencies in a signal over time. Amplitude is then represented on a third dimension with variable brightness or color.
Let's take a look at an audio file in a traditional waveform view and a spectrogram. First, here’s a sine wave moving up in pitch from 60 Hz–12 kHz, as seen in a traditional waveform:
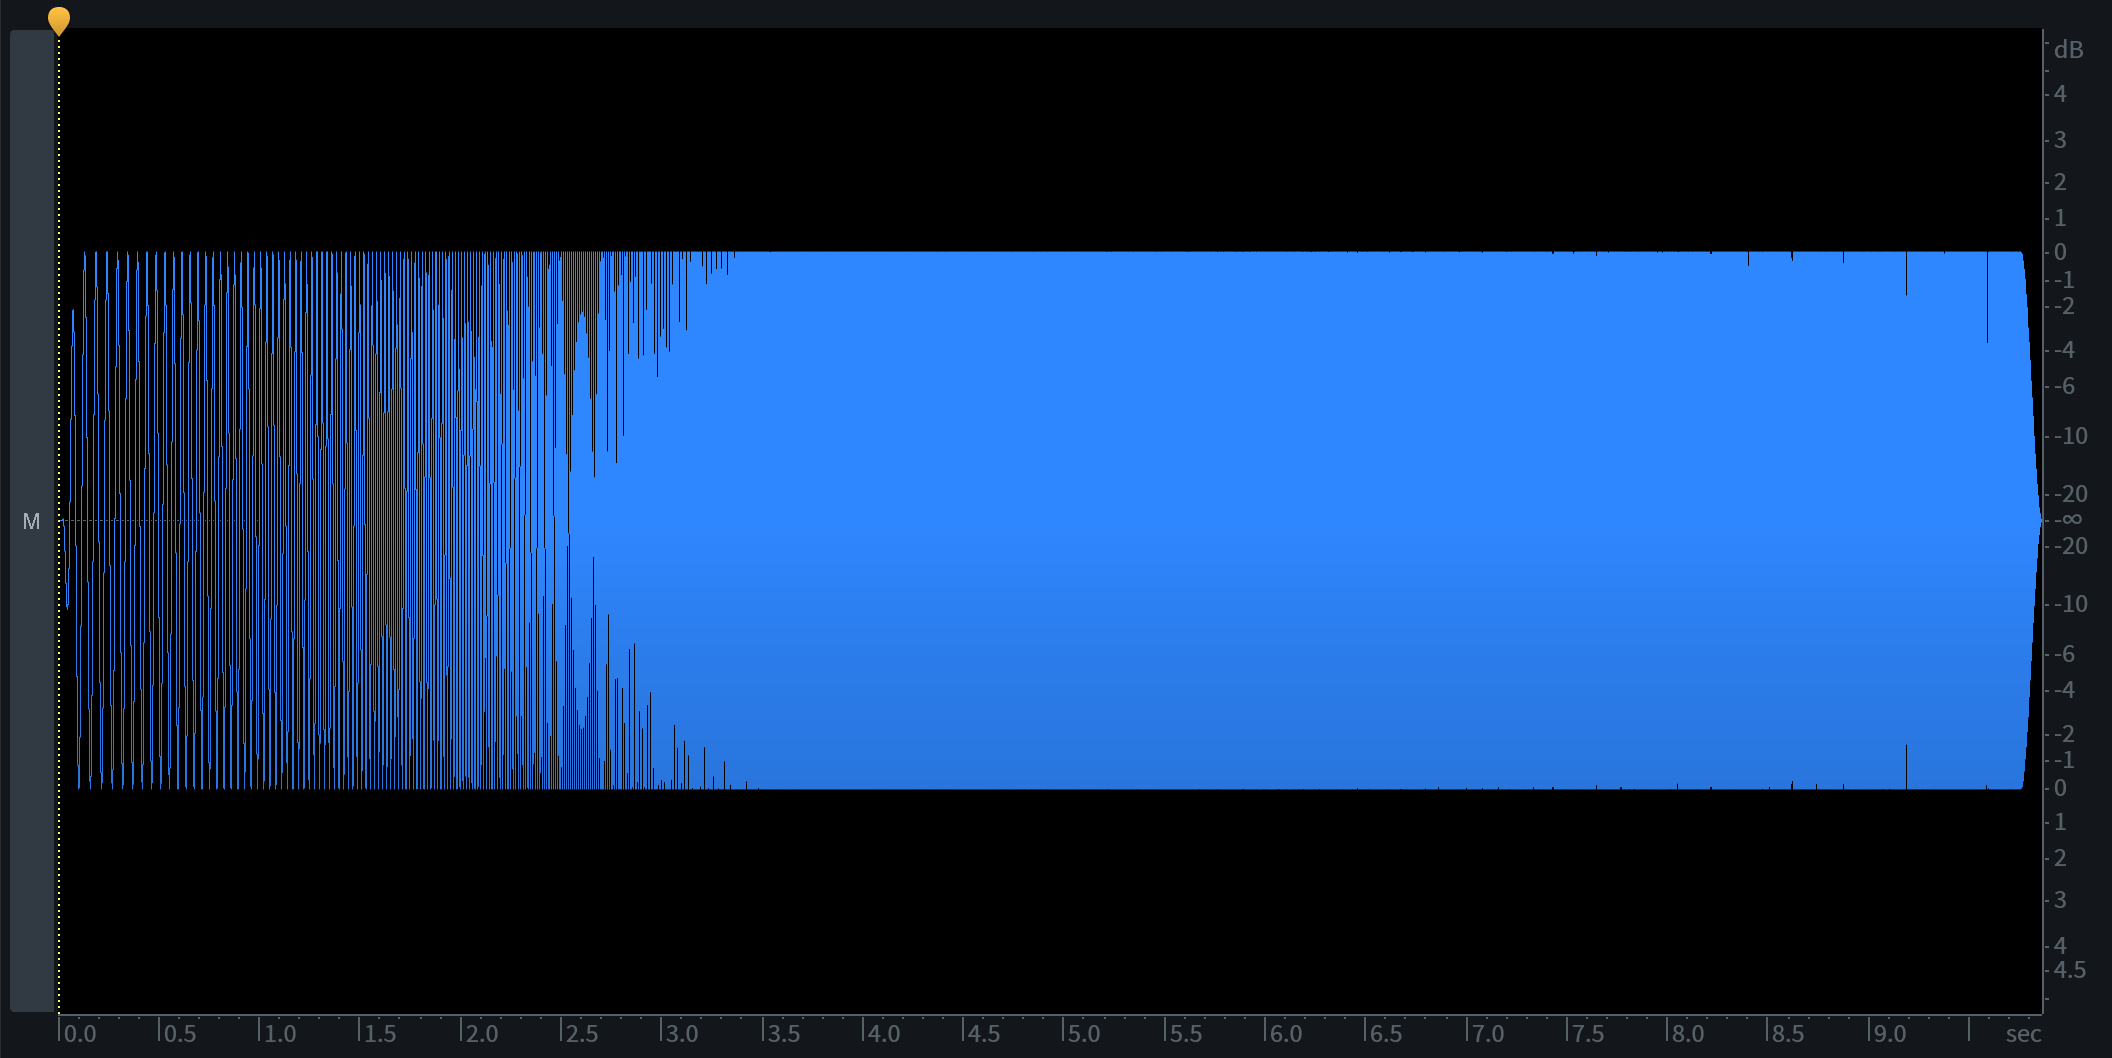
Pitching sine wave shown as a traditional waveform
You’ll notice that the waveform shows amplitude over time, but we can’t really see what’s happening at individual frequencies. We can see that the sine wave is at a consistent level for the duration of the file, but we can’t tell much about how the pitch or frequency changes over time.
Here is the same audio file using a spectrogram.
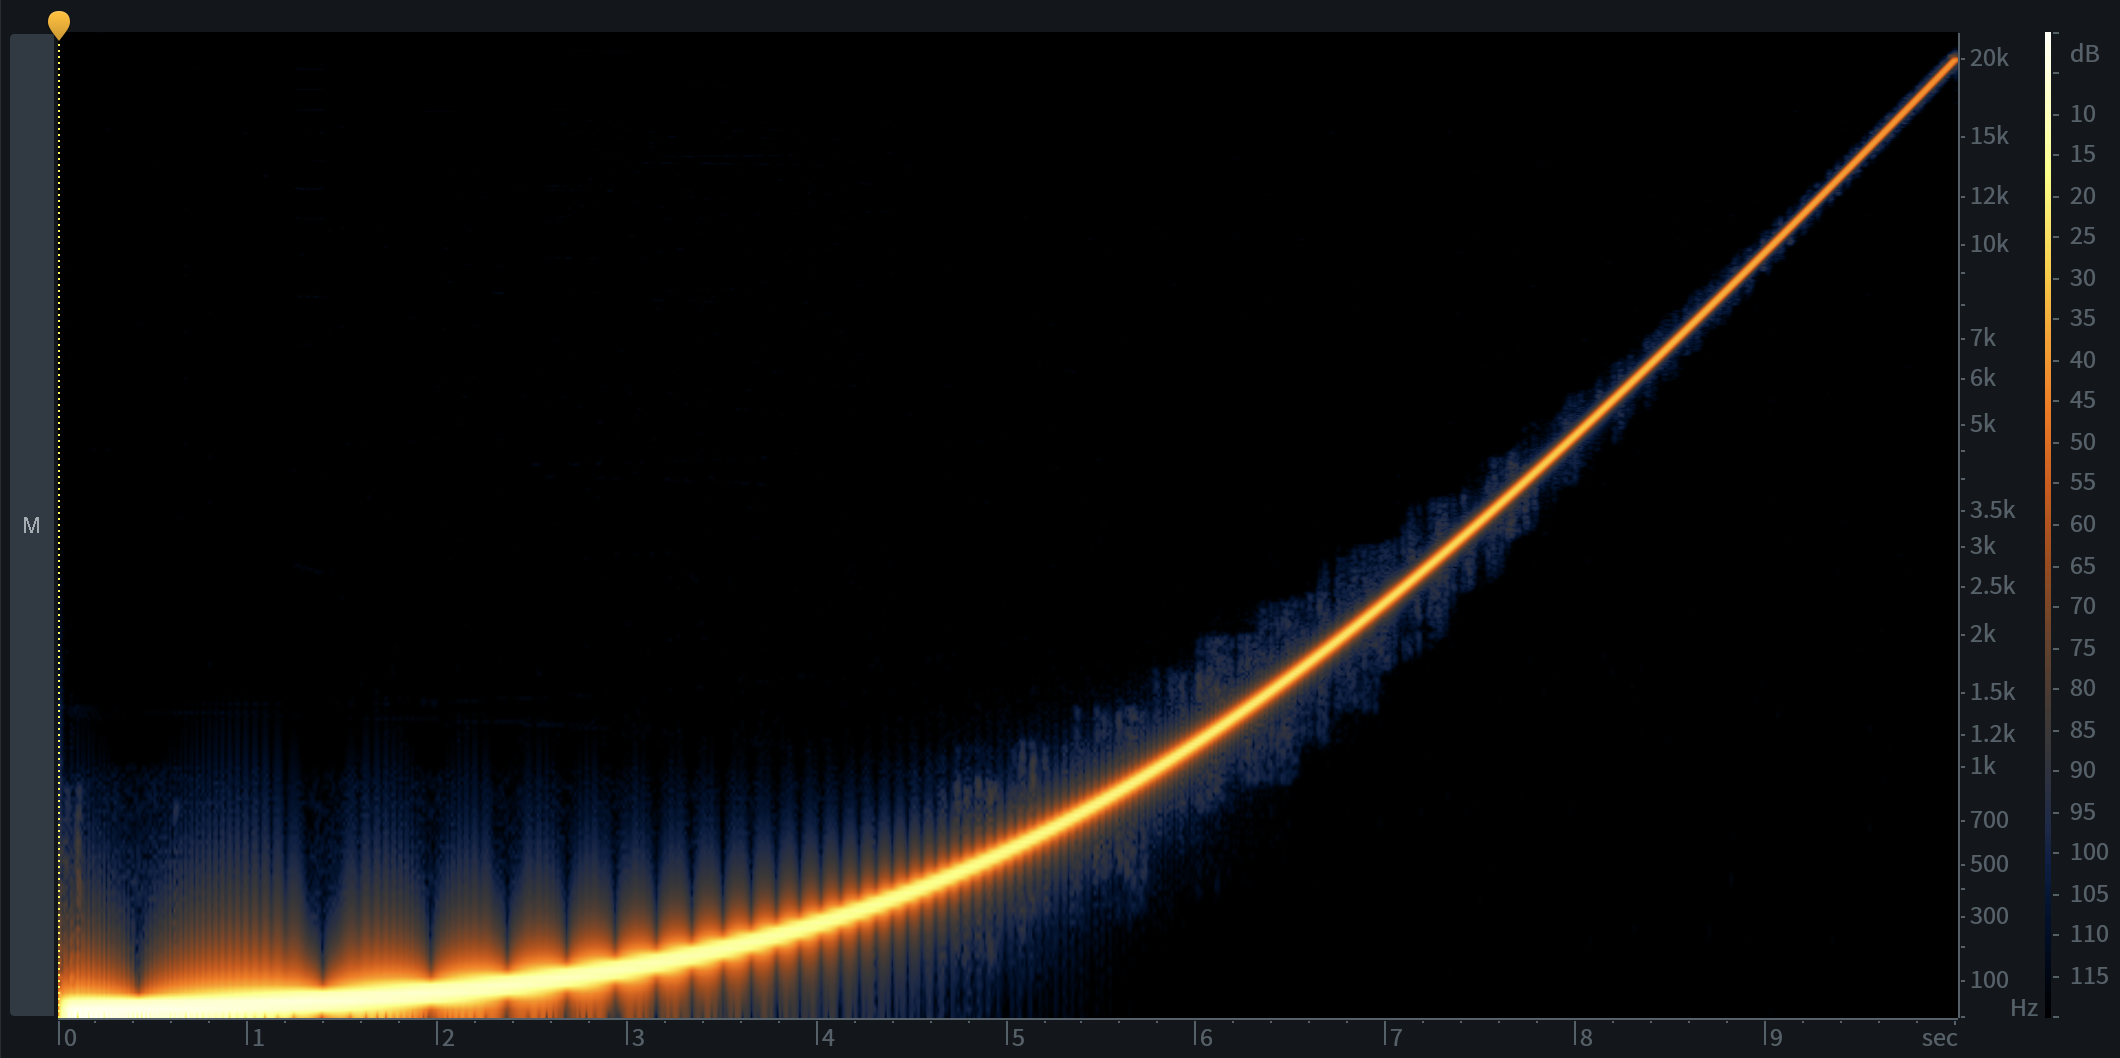
In the spectrogram view, the vertical axis displays frequency in Hertz, the horizontal axis represents time (just like the waveform display), and amplitude is represented by brightness.
The black background is silence, while the bright orange curve is the sine wave moving up in pitch. This allows us to view a range of frequencies (lowest at the bottom of the display, highest at the top) and how loud events at different frequencies are. Loud events will appear bright and quiet events will appear dark.
Now, let’s look at a more complex audio example: the human voice.
Here’s a short, spoken phrase as seen through a waveform display. What we see here is the amplitude of the spoken words over time.
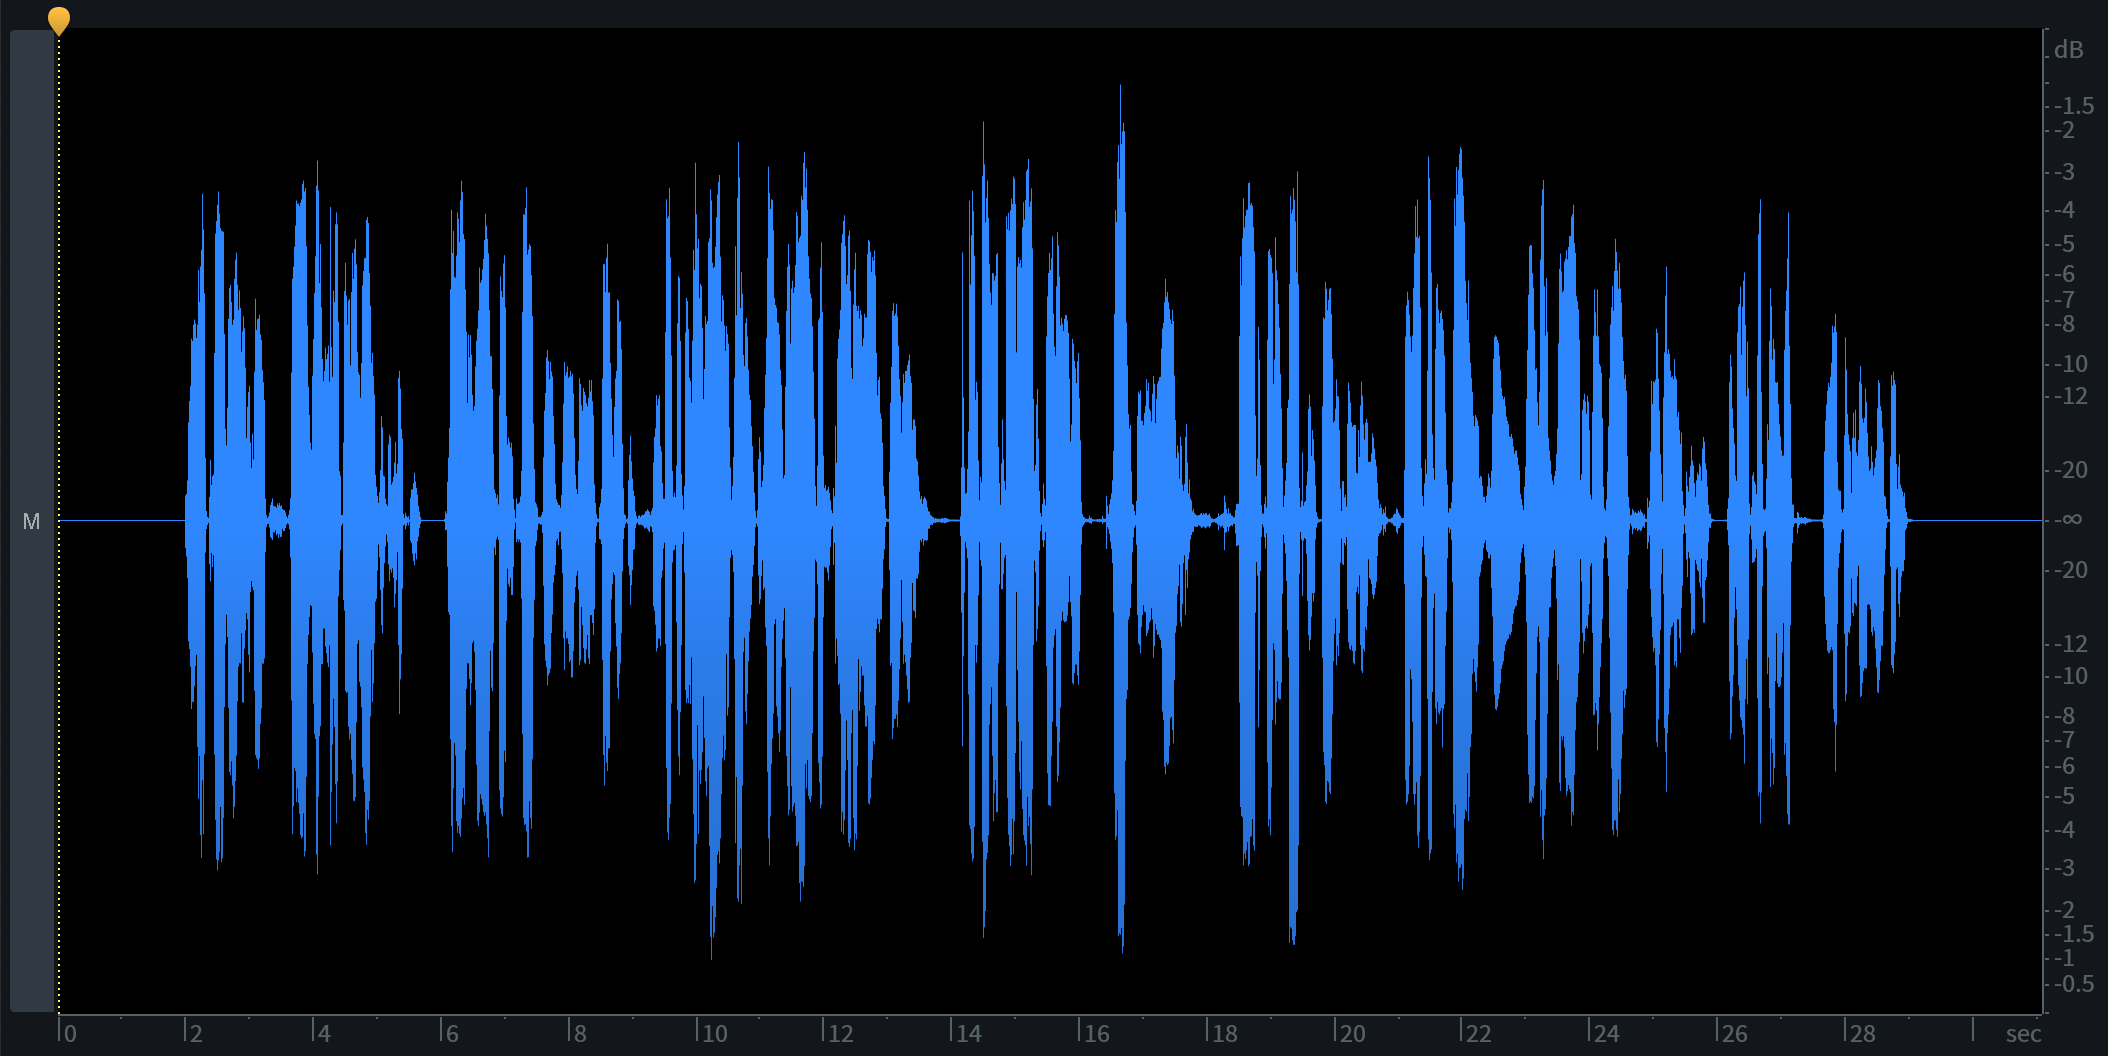
Dialogue shown as a traditional waveform
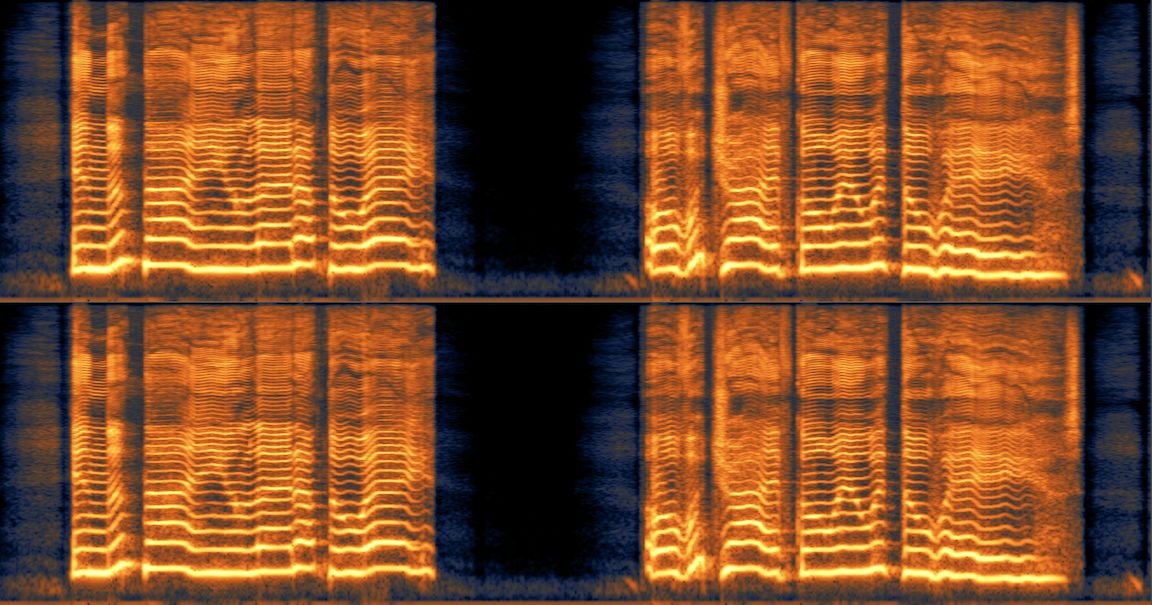
If we switch to the Spectrogram view, we’ll see many things we can’t see in the Waveform view.
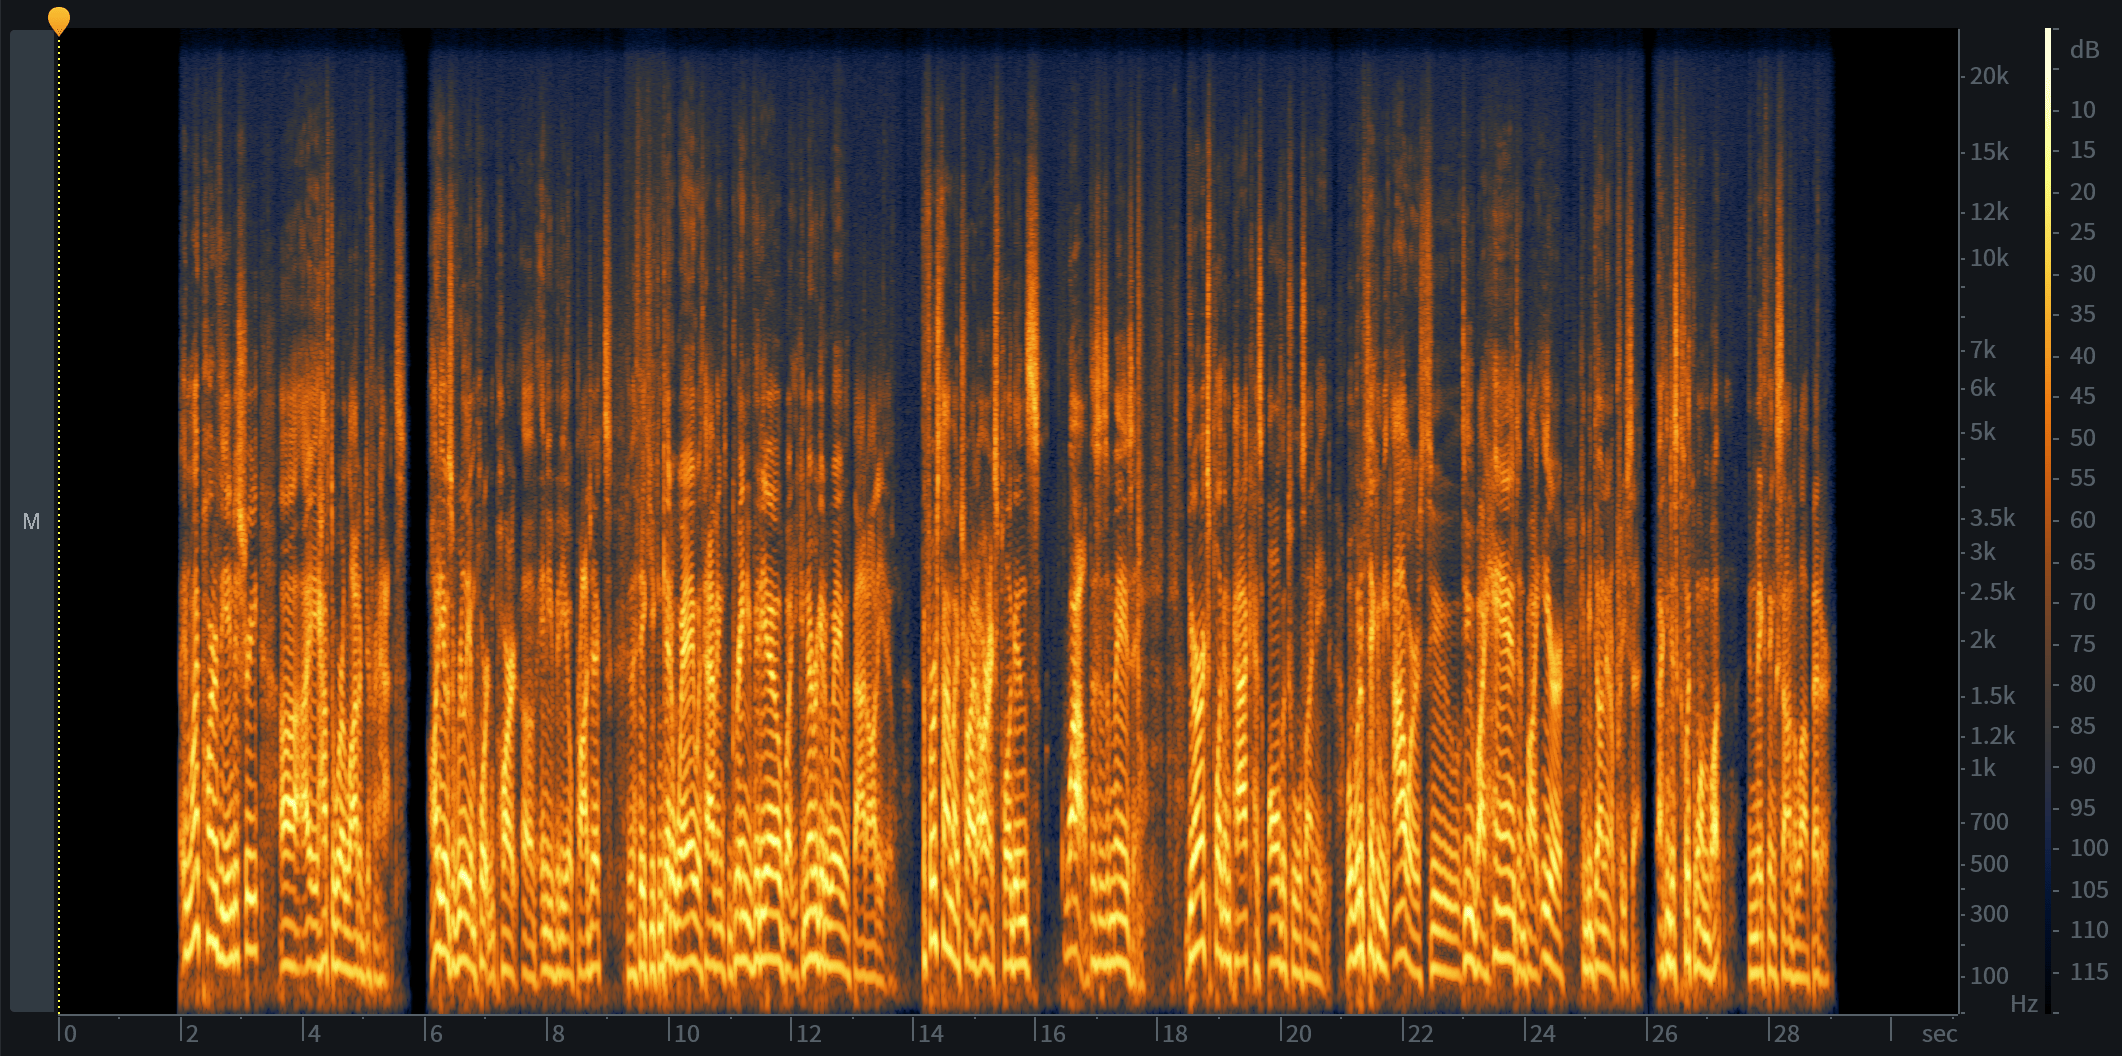
Dialogue shown in a spectrogram
This is why having a detailed spectrogram display is so important in audio editing: it helps to clearly display the problems that you might want to fix.
The key to successful audio restoration lies in your ability to correctly analyze the situation—much like a doctor recognizing symptoms that point to a certain illness.
Constantly training your ear to distinguish the noises and audio events that need to be corrected can be a life-long endeavor. Fortunately, as explained previously, spectrogram technology makes this task easier by representing those audio events visually.
Spectrogram/Waveform displays in RX
RX features an advanced spectrogram display that is capable of showing greater time and frequency resolution than other spectrograms, allowing you to see an unprecedented level of detail when working with audio.
An overview of the entire audio file's waveform will be displayed above the main Spectrogram/Waveform display in a Waveform Overview. The Waveform Overview will always display the entire audio file and will also display any selections made in the main display.
You can also view the traditional waveform, or a blend of both, by adjusting the Waveform/Spectrogram Opacity slider to the left just below the spectrogram.

Waveform/Spectrogram Opacity slider
The aim of any good visualization tool for audio repair and restoration is to provide you with more information about an audible problem. This not only helps inform your editing decisions, but, in the case of a spectrogram display, can provide new, exciting ways to edit audio—especially when used in tandem with a waveform display.
How to fine-tune the display
Not all spectrograms are created equal. An algorithm known as the “Fast Fourier Transform,” or FFT for short, is used to compute this visual display. Many plug-ins that feature a spectrogram display allow you to adjust the size of the FFT, but what does this mean for audio repair and restoration? Changing the FFT size will change the way the algorithm computes the spectrogram, causing it to look different. Depending on the type of audio you’re working with and visualizing, changing the FFT size may help.
As a rule, higher FFT sizes give you more detail in frequencies, referred to as frequency resolution, while lower FFT sizes give you more detail in time, referred to as time resolution.
If you’re trying to identify a plosive, mic handling noise, or other muddy low-frequency information, a higher FFT size in your spectrogram settings will help. If you’re trying to identify a high frequency event, or working with a transient signal (such as a percussion or drum loop), choose a lower FFT size.
Using the spectrogram to solve audio problems
There are a number of different audio problems that the tools in RX can help you fix. Identifying what kind of problem you have can help determine the most appropriate tool and method for treating the problem.
We’ve collected tips to help you identify seven common types of audio problems in a spectrogram, plus the modules in RX to remove them quickly and effectively. The audio problems we’ll be covering are:
- Hum
- Buzz
- Hiss and other broadband noise
- Clicks, pops, and other short impulse noises
- Clipping or distortion
- Intermittent noises
- Gaps and drop outs
Hum
Hum is usually the result of electrical noise somewhere in the recorded signal chain. It’s normally heard as a low-frequency tone at either 50 Hz or 60 Hz.
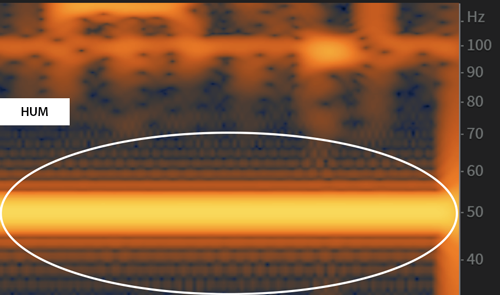
Hum shown on a spectrogram
You’ll see hum by zooming in on the low frequencies. It’ll appear as a series of horizontal lines, usually with a bright line at 50 Hz or 60 Hz and several lighter lines at harmonics.
To remove hum, use the RX De-hum module. It works best when frequencies of the hum do not overlap with any useful transient signals.
Buzz
In some cases, electrical noise will extend up to higher frequencies and manifest itself as a buzz. Sounds like these can also come from fluorescent light fixtures, motors, and some on-camera microphones.
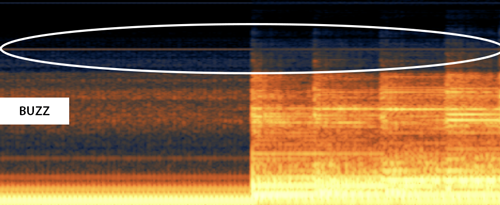
Buzz shown on a spectrogram
You’ll find buzz in high frequencies, where it will appear as a thin horizontal line.
To remove buzz at frequencies above 400 Hz, use the Spectral De-noise tool. For low-frequency buzz, similar to hum, the De-hum tool is more effective.
Hiss and other broadband noise
Unlike hum and buzz, broadband noise is not concentrated at specific frequencies and can be found throughout the frequency spectrum. Tape hiss and noise from fans and HVAC systems are great examples.

Hiss shown on a spectrogram
In the spectrogram display, broadband noise usually appears as speckles that surround the program material, as seen in the example.
Use the Spectral De-noise tool to remove these types of broadband noise.
Clicks, pops, and other short impulse noises
Clicks and pops are common on recordings made from vinyl, shellac, and other grooved media. They can also be introduced by digital errors, including recording into a DAW with too low of a buffer setting, or a bad audio edit that missed a zero crossing. Even mouth noises, such as tongue clicks and lip smacks, fall into this category.
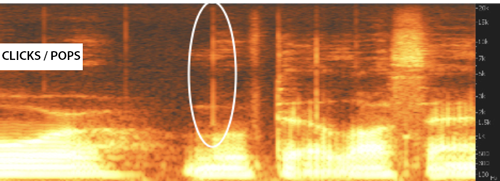
Clicks and pops shown on a spectrogram
You’ll see these short, impulsive noises appear in a spectrogram as vertical lines. The louder the click or pop, the brighter the line will appear. This example shows clicks and pops appearing in an audio recording transferred from vinyl.
For general clicks and pops, use the De-click module to recognize, isolate, reduce, and remove them. If you’re dealing with mouth clicks from a person speaking, the Mouth De-click module is the way to go.
Clipping or distortion
Digital clipping is an all-too-common problem in audio production. It can occur when a signal is too loud to be recorded by an analog-to-digital converter, mixing console, field recorder, or some other gain stage in the signal chain. This can cause distortion, and the loss of audio information at the signal’s peaks.
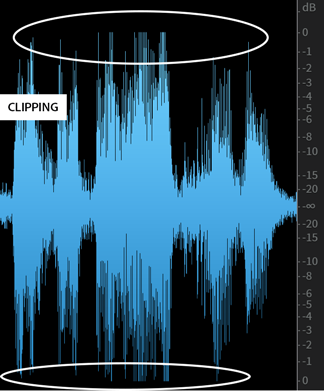
Clipped waveform
To identify clipped audio, you’ll want to work with a waveform display, rather than a spectrogram. The clipping appears as “squared-off” sections of the waveform.
Zoom in on a waveform to see where the wave has been truncated because of clipping.
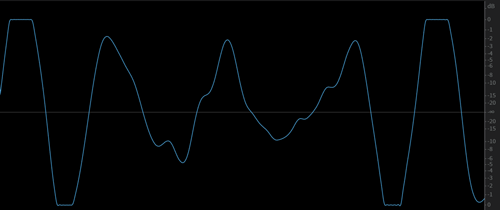
Truncated peaks of the clipped waveform
Note that sometimes, brickwall-limited audio will also appear “squared off,” but this doesn’t necessarily mean it will sound as heavily distorted as clipped waveforms that have been truncated. You can zoom in to see if the tops of individual waveforms are actually clipped.
To fix clipping, use the De-clip tool, which can intelligently redraw the waveform where it might have naturally been if the signal hadn’t clipped.
Intermittent noises
Intermittent noises are different from hiss and hum—they may appear infrequently and be inconsistent in pitch or duration. Common examples include coughs, sneezes, footsteps, car horns, ringing cell phones, birds, and sirens.
These noises can manifest themselves in various ways. Here are a couple examples:
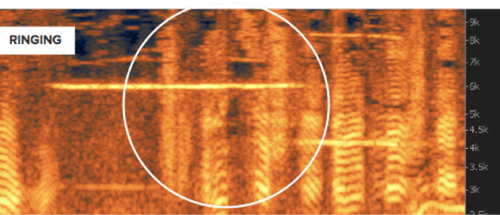
Ringing shown on a spectrogram
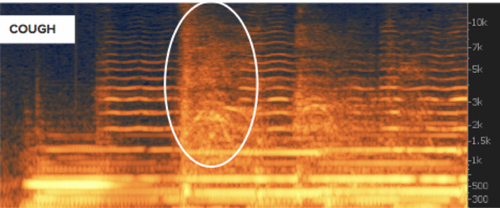
A cough shown on a spectrogram
Use the Spectral Repair tool to isolate these intermittent sounds, analyze the audio around them, and attenuate or replace them.
Gaps and dropouts
Sometimes a recording may have short sections of missing or corrupted audio. These are called gaps or dropouts.
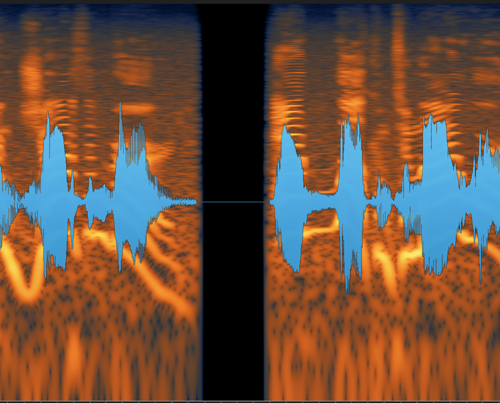
A dropout shown on a spectrogram
These are usually very obvious to both the eye and the ear, and appear as a gap in the spectrogram display.
Use the Spectral Repair and Ambience Match tools to replace missing audio elements and create a consistent audio track.
How to read spectrograms: interpreting time, frequency, and amplitude
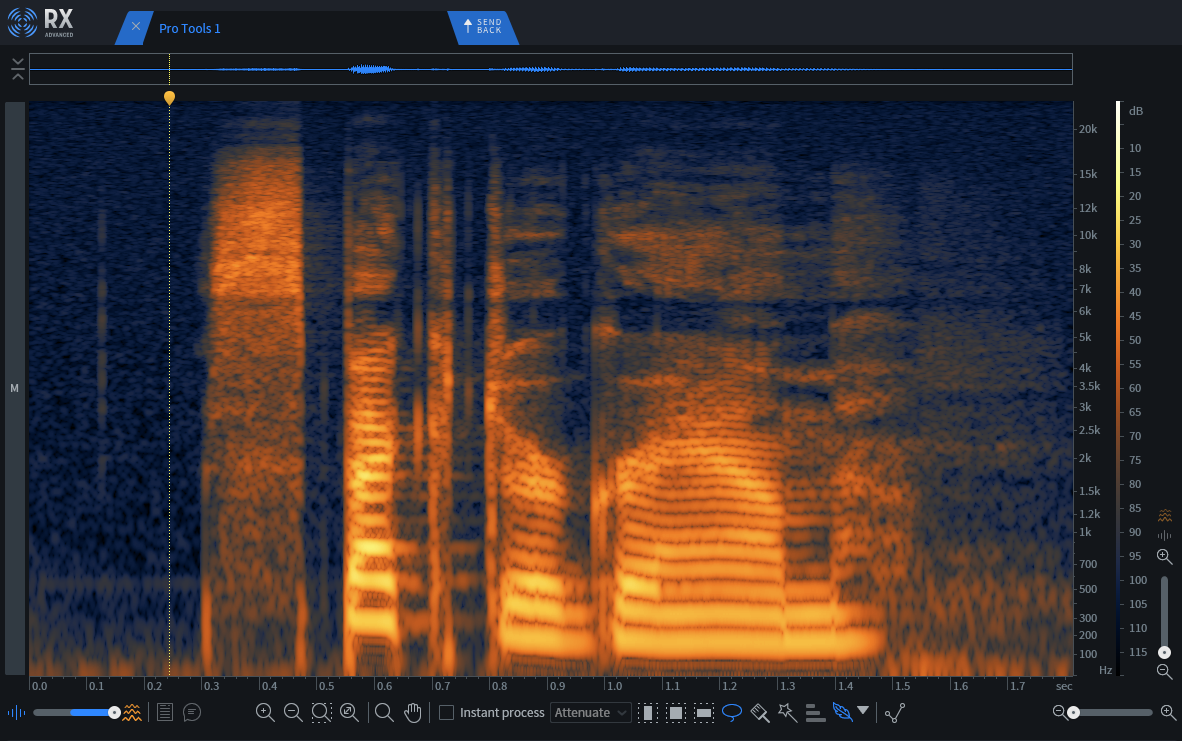
Below is a recording of the word "spectrogram" and what the word looks like in a spectrogram. The bottom axis that goes from left to right shows a progression of time measured in seconds. The axis on the right that goes from top to bottom shows frequencies with the lowest frequencies being at the bottom and higher frequencies at the top. The brighter the orange color is, the more amplitude or volume that particular bandwidth of frequencies has.
Spectrogram of an audio recording in iZotope RX 11
In the above image, near the cursor at the top left side of the spectrogram, the brightest orange section indicates that the loudest part of the audio is made up of frequencies that are higher in pitch. If we look at the axis on the right, this area corresponds to between about 7 kHz and 15 kHz. This section is the hiss of the letter S in "spectrogram."
Looking at the bottom axis, we can see that this S sound occurs at about 0.3 – 0.4 seconds into the audio clip. The sections that follow (between 0.5 – 1.5 seconds) show the more resonant, lower pitch of the rest of the word, centered between 100 Hz and 500 Hz. This is why the bright orange has shifted lower in the image.
Applications of spectrogram in audio analysis and music
Using spectrograms is helpful in audio cleanup and in music. In mixing music, spectrograms can show us when we have an imbalance in frequencies such as too much high end or low end. It's also very helpful in visualizing issues with a recording such as click track bleed, as pictured below.
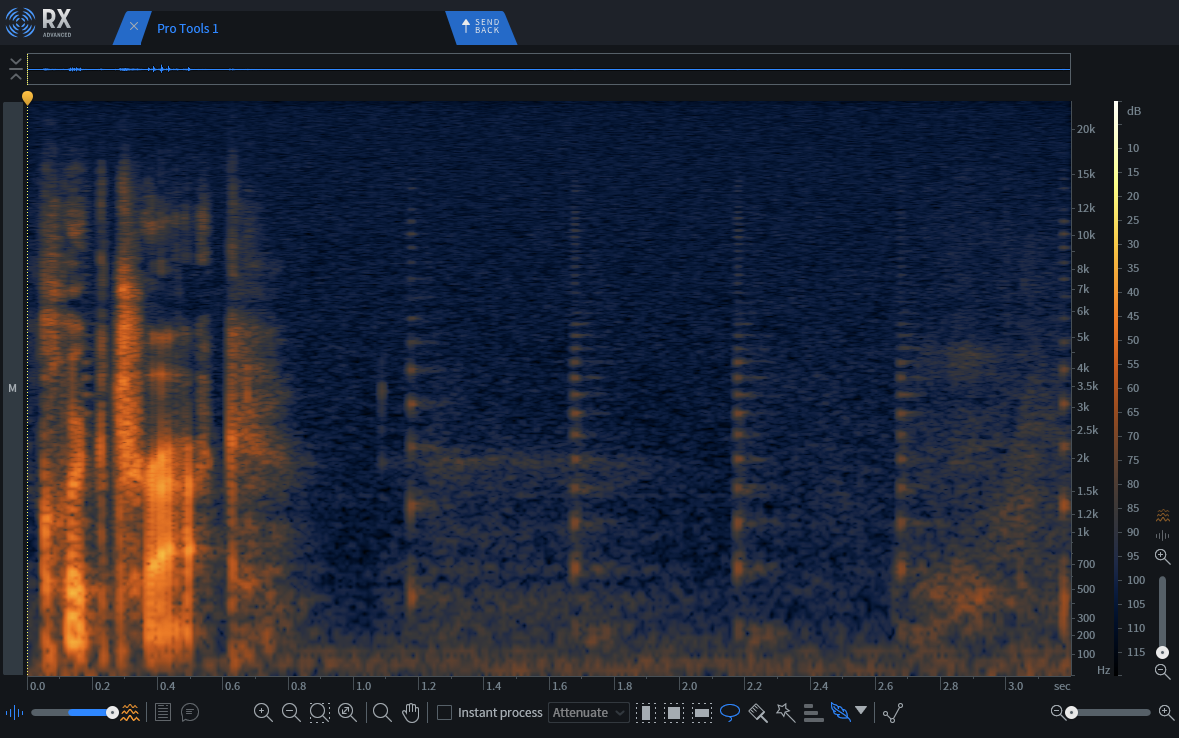
A spectrogram shows bleed from a click track at the end of a vocal phrase
Spectrograms are used in other cleanup jobs as well. In the following example, there is a smoke detector beep in a dialogue recording. We can see it as well circled in the following spectrogram. Using RX 11, we can highlight the offending noise and remove it using Spectral Repair.
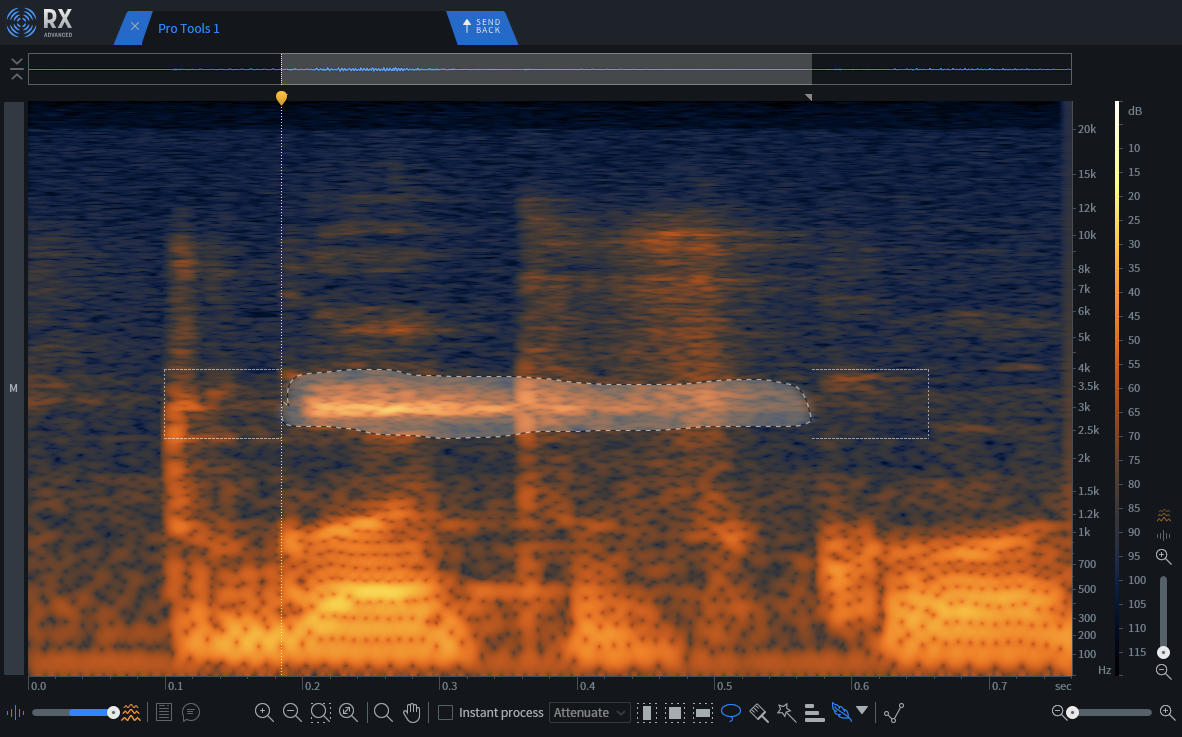
RX 11 shows a spectrogram of a beep from a smoke detector during a dialogue recording
Spectrograms vs. spectrographs
While spectrogram and spectrograph are sometimes (incorrectly) used interchangeably, there is an important distinction to be made. A spectrograph is the analyser that converts the audio information it receives into a graphical output. The output of a spectrograph is the spectrogram. For example, what we are looking at in the above screenshots are spectrograms created by iZotope RX 11. That means that RX 11 is the spectrograph in this case.
Start using spectrograms today
Spectrograms are quite handy because they display all frequencies, giving us a 3D visualization of our audio over time. With simple waveforms, we can see obvious glitches such as snaps and plosives, but the extra layer of detail a spectrogram provides is essential to understanding how our audio is impacted by extraneous noise and by our own mixing decisions.
