RMS levels defined: how to get consistent loudness levels in mastering
Monitoring and understanding RMS levels can assist in preserving a reasonable loudness and maximize the fullness of a track. Learn about RMS levels and how to implement metering tools to analyze them correctly and aesthetically.
Despite the audio industry heaving a sigh of collective relief in the retirement (mostly) of the “Loudness Wars,” it is important that a song can stand up tastefully against other tracks in a similar genre in a playlist. People talk about the “secrets” to getting tracks to sound loud, but there really are no secrets. A good sounding room, speakers and gear you can trust, artistic nuance, and understanding terms referring to loudness – such as LUFS, Peak vs. True Peak and last but not least, RMS levels – are the foundation blocks to all else in the process.
RMS levels are important to a track standing “on its own” against others. RMS stands for “Root Mean Square” and measures the average of a constantly changing value (like an audio signal) over time – usually around 300 ms or so.
In this tutorial, we’ll further define what RMS levels are and how to implement metering tools to analyze them correctly and aesthetically.
Follow along with iZotope


Insight 2
What are RMS levels?
As written above, RMS stands for “root mean square” – the average of a constantly varying signal over a given period of time. In electrical terms, this is the average power of an AC (alternating current) signal. An RMS value is the AC equivalent to a DC (direct current) voltage generating heat through a resistor.
RMS levels are useful when talking about speaker systems. It shows the max electrical power that a system can handle over a period of time. In music production, this same analysis can be applied to the power of a complex waveform, and how it relates to loudness.
Peak, True Peak, and LUFS are all interconnected terms that are related and work in tandem with RMS levels. If you need a refresher on loudness in general in the context of mastering, check out this guide on loudness.
RMS vs. peak levels
RMS levels are different from peak levels, but the two are both important in understanding the full picture of loudness of a track. Peak levels are a measure of the highest level of a signal at a specific point in time. Peak levels are important in understanding how close the highest level is to the ceiling, or where the audio would begin to clip and distort. True Peak levels go a step further and take into consideration the analog reproduction of the digital signal. It analyzes the signal and determines intersample peaks and as well as any point where the digital signal may clip on playback.
Related to peak levels – another important characteristic in describing loudness is crest factor. It is the decibel difference between the average RMS level and the peak level. Different genres of music have “optimal” crest factors – an EDM track will most likely have lower decibel difference between peak and average than say, a string quartet. There’s no “rules” when it comes to crest factor, but aesthetics and staying appropriate to a genre is key when interpreting this particular consideration.
A word about LUFS
Since we’re talking about RMS levels, it’s important to mention how they relate to LUFS – Loudness Units Full Scale. LUFS is similar to RMS in that it measures average loudness of a signal or system. Additionally, it adds to that analysis human perception of sound, which makes LUFS a good stat for understanding the average loudness over an entire song. For a more in-depth description of LUFS, see our LUFS guide.
Before we dive into an example, it’s important to mention that set LUFS loudness levels for streaming services – such as Spotify or Apple Music – are the services’ standards. I personally have tried to use them as a guide. -14 LUFS, which is the Spotify standard (when the listener has loudness normalization is turned on, all files will be normalized to -14 for playback), may work as a spec for some music (a more acoustic singer/songwriter track, perhaps) but would probably not be a good target for say, an EDM song. And other services have different standards – so even standards between services are different.
Overall, mastering for streaming services is not about hitting an exact number as the end all be all goal. It is about making educated, conscious decisions about overall loudness, crest factor, and genre aesthetics to come to a number that satisfies both the artist and technical standards. While egregious compression and limiting may add unwanted distortion and clipping, leading to a mix falling apart – being too precious with those processes can prevent the benefits of compression (overall level, punch, color, feeling) from making a mix as full and as great as it can be.
And a note on delivering files to mastering engineers – While there are no hard and fast rules on levels when delivering files to a mastering engineer (see this article on working with a mastering engineer for some tips), a decent amount of headroom and dynamic range is a good guideline.
If you’re using compression and limiting on the final mix, it can be helpful to back off a bit on both to allow for more flexibility in the mastering process, as the engineer will probably make things louder anyway!
And if you’re unsure what to do, more information is always better than less. Send both versions and have a dialogue with the engineer and together you can figure out which version to move forward with. Usually, headroom between -3 to -6 dB is standard, but again – aesthetics, best judgment, and a good mix in general help determine what you send.
How to use RMS levels in audio production
Now that we understand what RMS levels represent we can use them along with other signal analysis to determine consistency of loudness in a song, or across multiple songs.
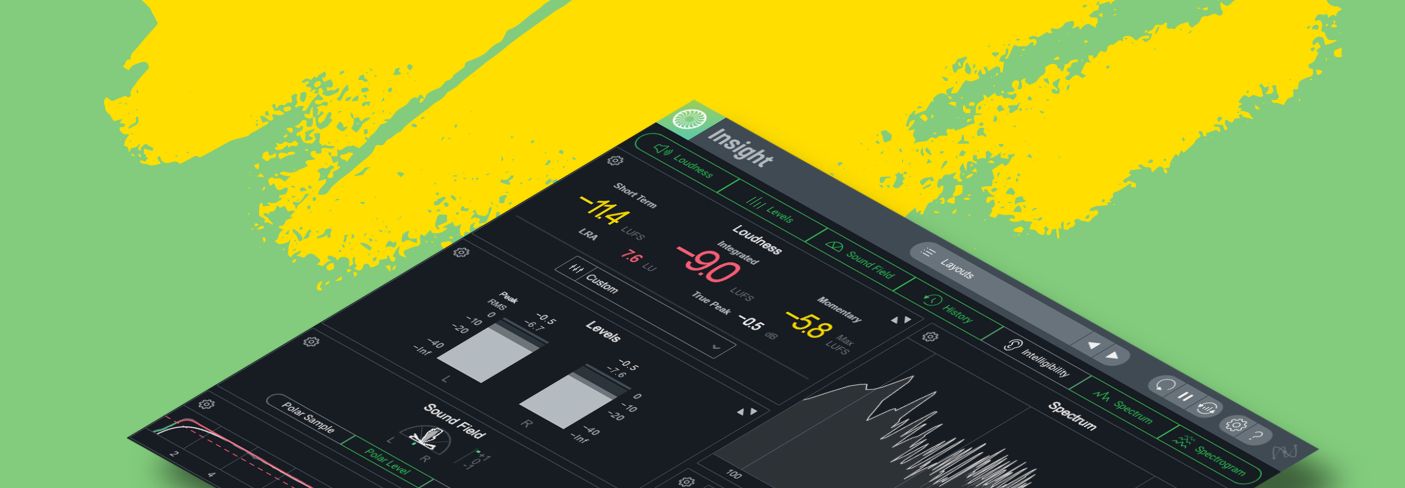
iZotope Insight is a metering and analysis plugin that allows you to see the full picture of loudness and frequency content of your mix.
Below are the Insight plugins set up in a layout that uses all the modules available to you, save for Intelligibility – that module is helpful for post-production or film, but isn’t necessarily relevant here.
When it comes to RMS levels in mastering, placing Insight 2 at the end of your chain after your limiter will be a good way to analyze the final output of audio.
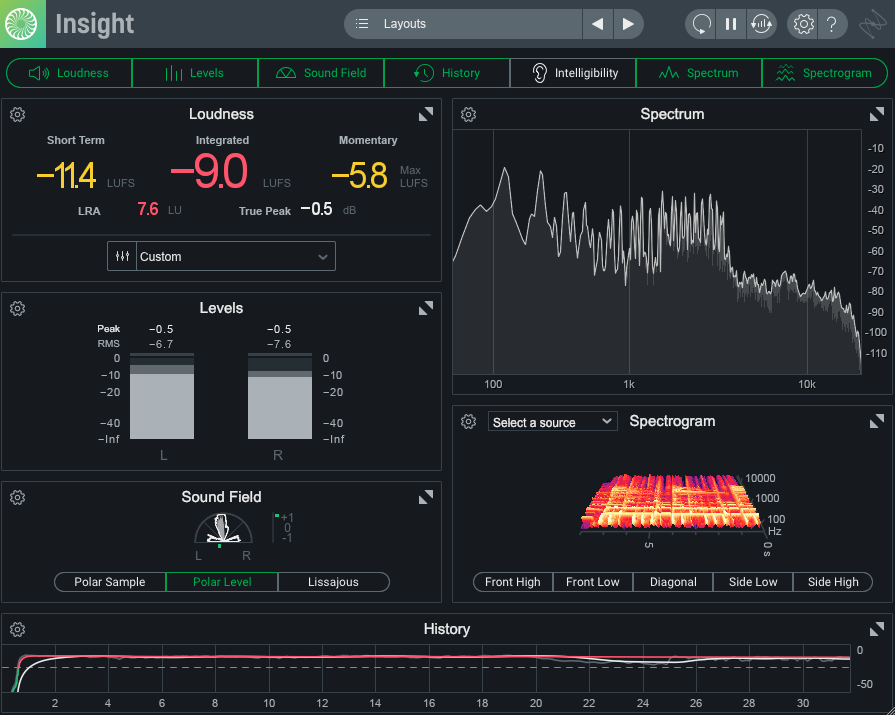
Analysis of a track using an extended Dynamics Analysis layout
The audio I analyzed in this case was a track by the band The Stress of Leisure – I used Insight while mastering their album to help me get consistent levels across the record and to confirm what I was hearing with what I could see. Mastering with your eyes is not a good idea, but having statistics, particularly when it comes to loudness, is helpful.
For a rock track, anywhere between -7 and -14 LUFS integrated usually sits well for me. Again it all depends on many factors, but when I look back on projects and how they stood up against other commercially released music (that I think sounds good!) of the same genre and time period, that’s where things seem to land.
LUFS levels in classical music may be much lower, perhaps -20. An intimate jazz record may sit around -18. Again, it depends. You can see the RMS levels on the meter are a little bit different than LUFS – the measurement time is shorter, and RMS doesn’t take into account loudness curves, but in conjunction with everything else it gives a good idea of where a song’s loudness lands.
Here’s a snippet of the track:
Having the spectrograph was helpful in seeing where the “power” was in each track, where most of the energy lay. You can choose different sources in the spectrogram – I chose the output as that was where I felt the meter was most useful in my case. Insight does this by communicating between compatible iZotope plugins using Relay.
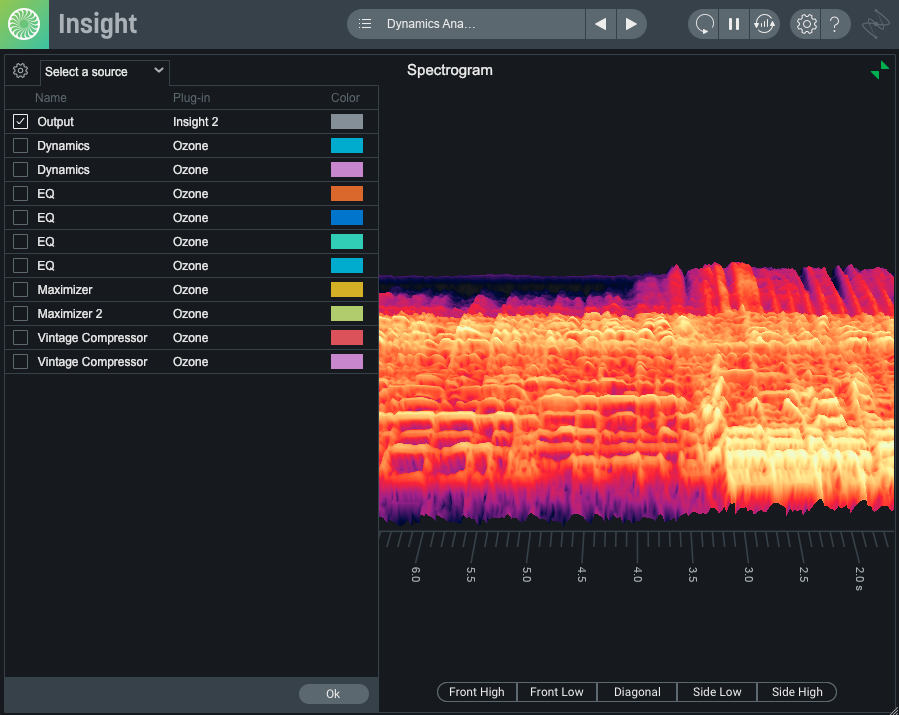
Spectrogram in iZotope Insight
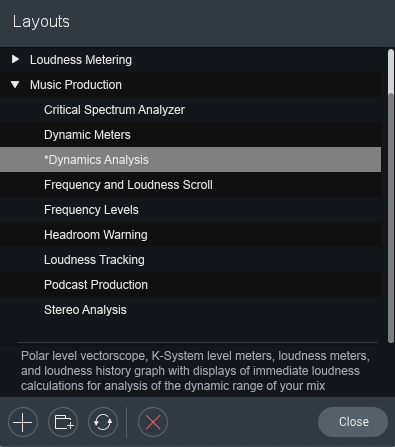
Presets available for music production in Insight
You can remove and add modules by clicking on them at the top of the plugin – some might not be needed in your case! You can choose from presets suitable for film, post, and music production.
To make sure the loudness module is using Peak + RMS levels for the meters, click on the gear at the top of the module, go to “Levels” and click on Peak + RMS levels.
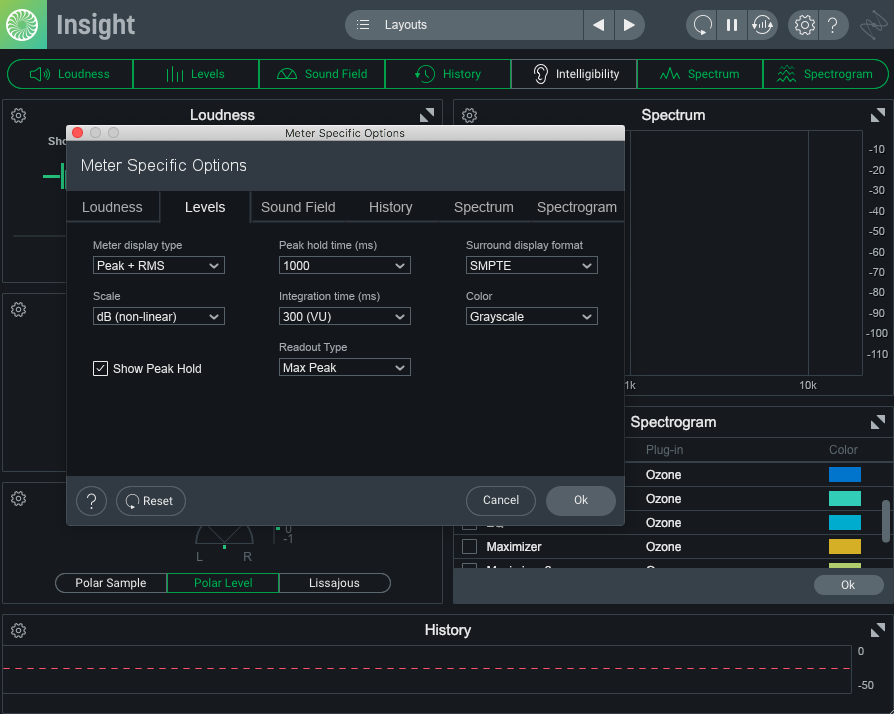
Peak + RMS levels in Insight
Here’s one more example of how a song looks in Insight in real time (as much as real time it can be in a screenshot!)
This track was more dense, and it shows in the spectrogram, as well as RMS and LUFS levels. The brighter the color (in this case) the more energy.
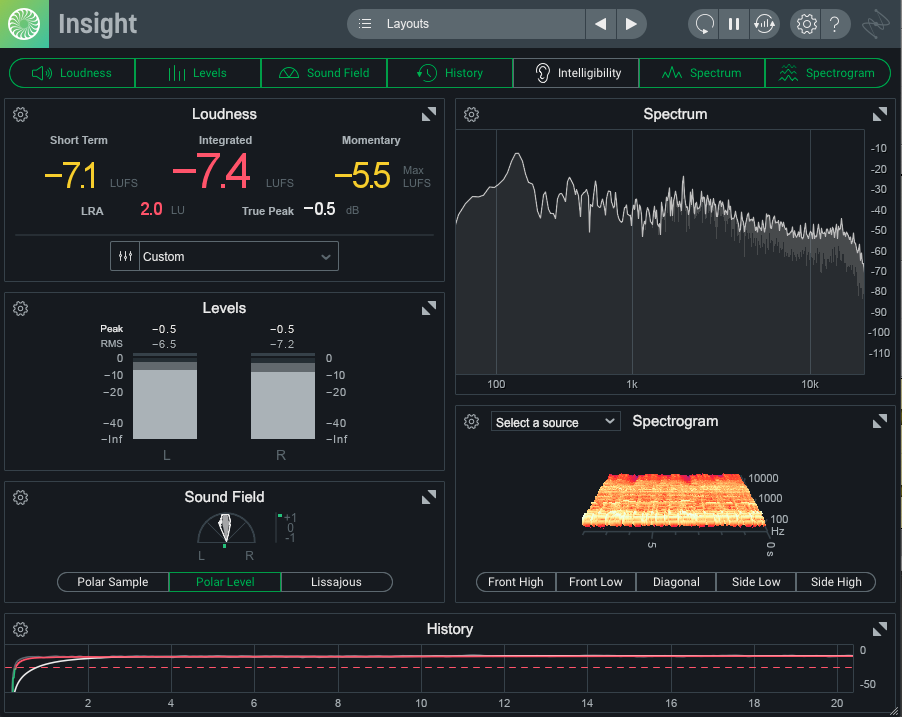
Analysis of a track using an extended Dynamics Analysis layout
Start using Insight to measure RMS levels
Understanding how RMS levels are related to peak levels, crest factor, LUFS, and spectral density will help you more fully understand the overall loudness of a track.
Using Insight at the end of your master and customizing it to your needs will help make your masters more consistent, commercially viable, and professional sounding.

