A LUFS and tonal analysis of the top-charting tracks from emerging artists
Discover how Billboard’s top emerging artists master loudness, dynamics, and tone. In-depth analysis of chart trends, sonic qualities, and mastering techniques.
Continuing my run of music analysis articles, in this piece we’re taking a look at a slightly different angle. Specifically, we’re going to look at some of the top songs by Billboard’s top emerging artists. What makes this angle particularly interesting to me is that I often work with new artists who are worried their music won’t “compete” in the market if it’s not a specific loudness.
Analyzing some music by top emerging artists seemed like a great way to assess the validity of this concern, so let’s jump in and take a look at – and listen to – some of the metrics and sonic characteristics of songs by some popular new artists.
Follow along with this tutorial using
![]()
![]()
RX 11 Advanced
What are we analyzing?
In this piece, we’re looking at the Billboard Emerging Artist chart, which may be a little different from the charts you’re more accustomed to from Billboard. While charts like the Hot 100, Global 200, or Hot Dance/Electronic Songs list specific songs, the emerging artist chart shows things from a slightly different perspective. Here’s Billboard’s own description, with emphasis from me.
“The week's most popular developing artists, using the same formula as the all-encompassing Billboard Artist 100, which measures artist activity across multiple Billboard charts… However, the Emerging Artists chart excludes acts that have notched a top 25 entry on either the Hot 100 or Billboard 200, [or who] have achieved two or more top 10s on Billboard's "Hot" song genre charts and/or consumption-based "Top" album genre rankings.”
So, since the chart is specifically listing artists and not songs, I have done my best to find the songs that first launched the listed artists into the “Emerging” category. Further, the chart includes 50 artists each week, so to narrow that down to a manageable number to analyze, I’ve only included artists who had managed to notch a number one position as of the week of March 22nd.
This left me nine songs, all of which I’ve written at least a little something about below, along with providing some vital credits, stats, and images showing a short-term LUFS trace and the tonal balance average of the full song.
Song analysis process
There are a few common questions people have when they read one of my analysis articles, so let’s cover those up front:
What sources were used for analysis? For each of these songs, I purchased and downloaded the lossless, high resolution – when available – file from the Qobuz store. This ensures that no streaming codecs or other hiccups get in the way. In a few, rare instances when a title isn’t available on the Qobuz store I will stream the lossless version from Apple, at the native sample rate, with loudness normalization turned off.
Do the numbers include any normalization? No. All analysis is done at the full, mastered level. That said, music discovery trends tell us that something like 85% of casual listeners listen with normalization turned on. So, just because something is mastered “loud” doesn’t mean that’s how people will experience it next to something “less loud.” In fact, in a predominantly loudness normalized playback world, I would argue that raw LUFS measurements tell us more about density than they do “loudness” – but that’s an article for another time.
What about Atmos? Don’t those need to be at -18 LUFSi? Yes, the loudest Atmos mix on an album needs to not exceed -18 LUFS, integrated. In fact, in some cases where both Atmos and stereo mixes of a song exist, we have an unusual and interesting opportunity to compare more and less dynamic versions of a song. For this analysis though, only stereo versions were used.
So, in short, this analysis uses downloaded lossless files with no normalization – or any other processing – applied, with very few exceptions where titles are streamed. In either case, they are as close to what the mastering engineer was listening to as we can get!
The music
If you’d like to listen along to the songs as you read, here’s a playlist with all songs, in order. Let’s get into it!
1. “Ordinary” by Alex Warren
Producer(s): Adam Yaron
Mixing: Alex Ghenea
Mastering: Randy Merrill
Peak Position: 1
Weeks on chart: 35
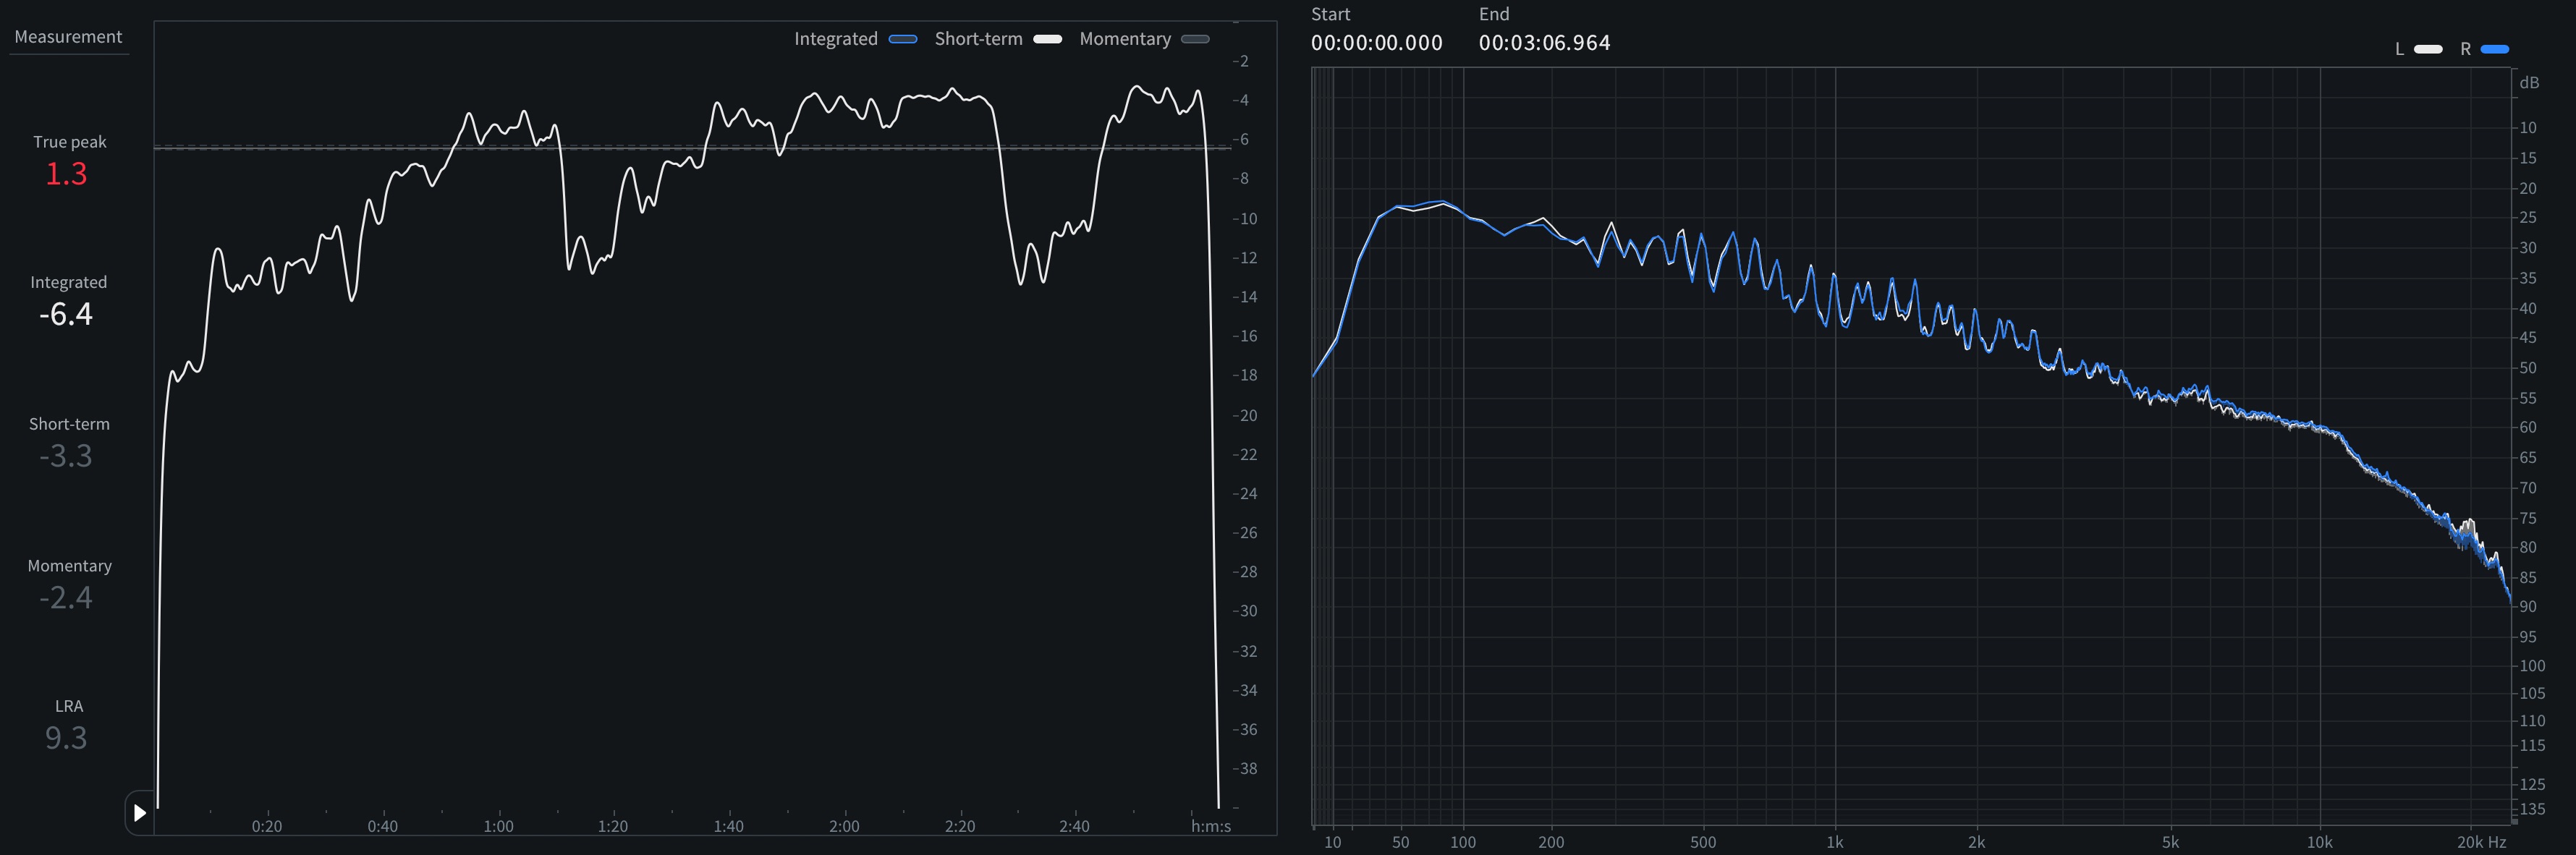
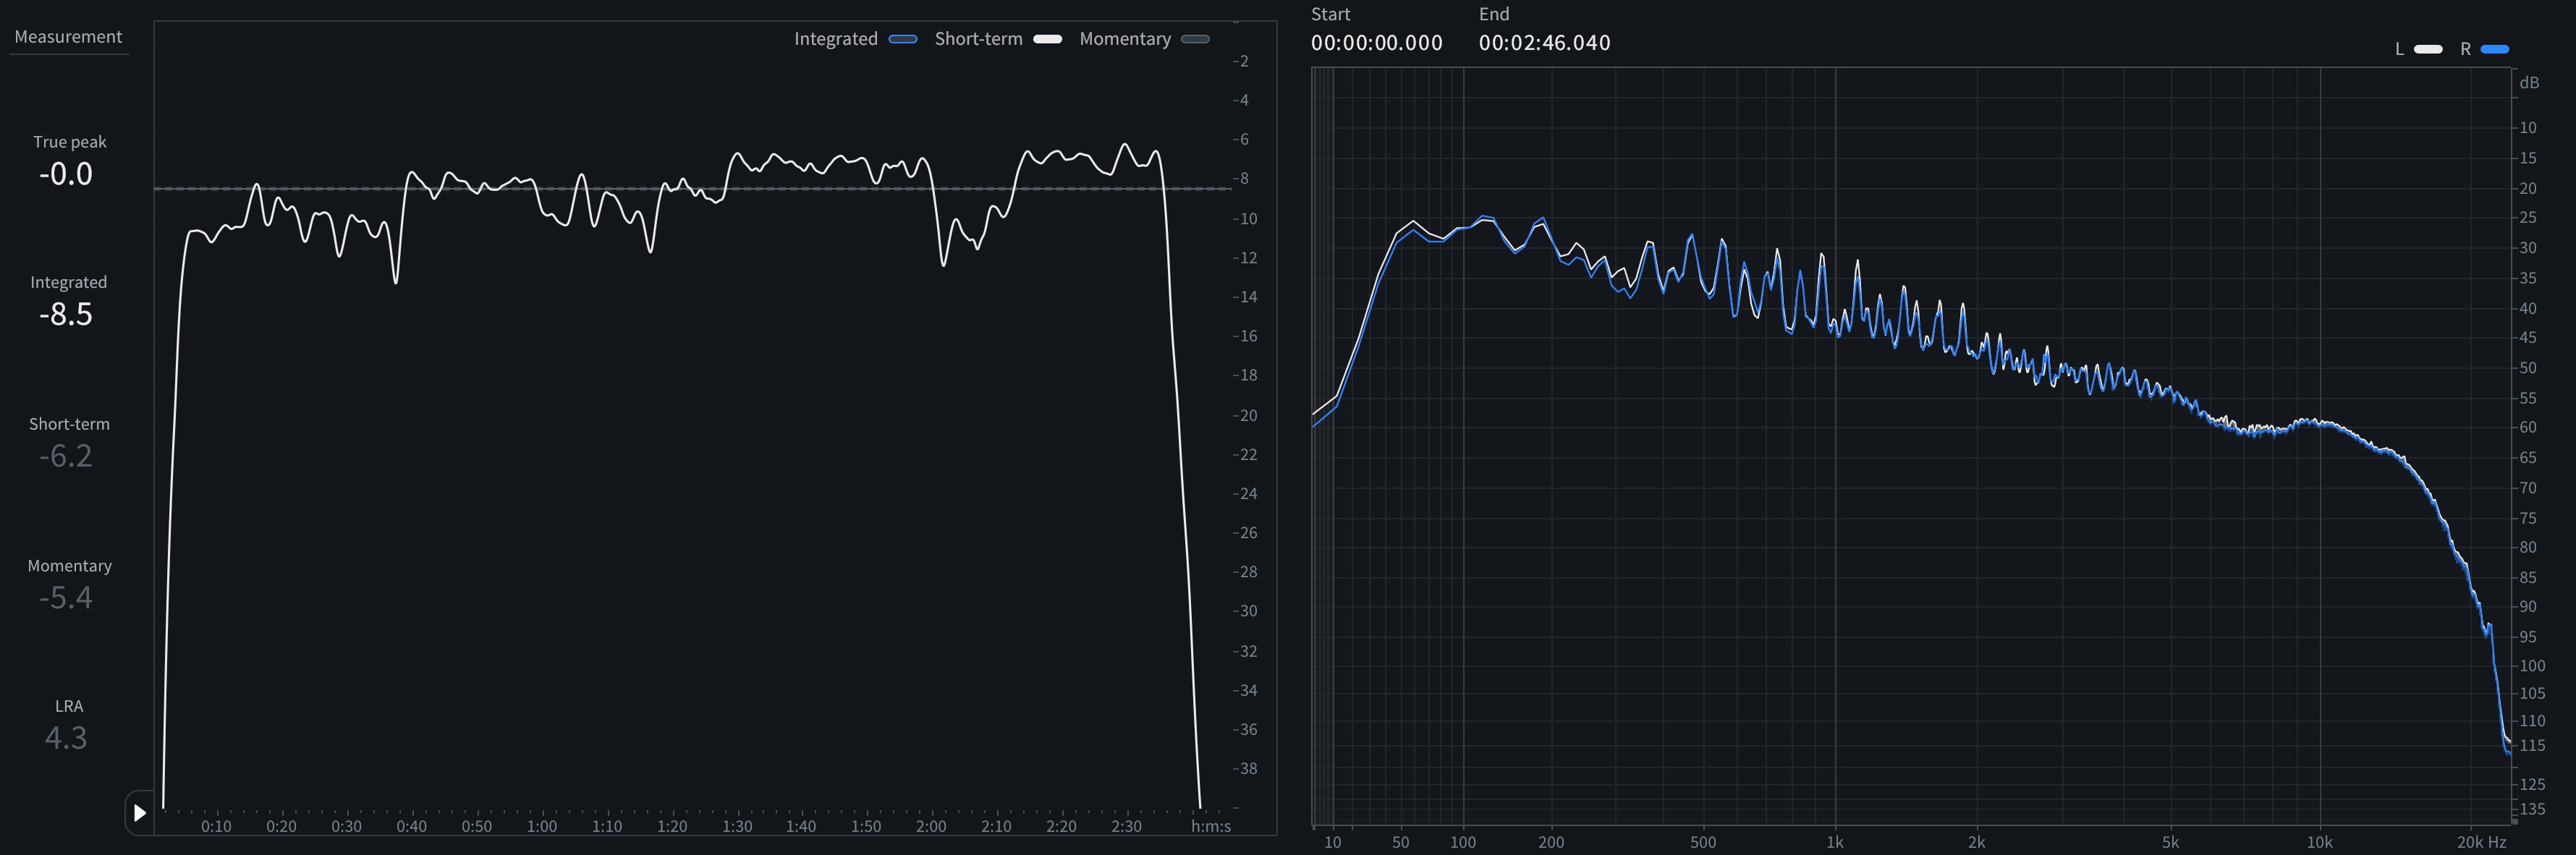
Short-term LUFS and spectrum of “Ordinary”
True Peak: 1.33 dBTP
Sample Peak: 0.00 dBFS
Int. Loudness: -6.4 LUFS
Loudness Range: 9.3 LU
One thing that surprises me in these analyses is how every so often, work from engineering teams who I greatly admire seems to miss the mark. Maybe that’s down to personal preference and aesthetics – some of which I generally allow to seep into these articles, since I figure you’re partially here for my opinion – or maybe it’s attributable to what’s handed over from production and recording.
Whatever the case, the amount of audible clipping and distortion in “Ordinary” was more than I would expect. Don’t get me wrong; clipping can absolutely be a key component in modern mastering, it’s just that usually it’s used because of its transparency on very brief transients. Here, though, it’s starting to dig into the body of some individual bass notes.

Clipping in “Ordinary”
Compare this to something like “supernatural” by Ariana Grande, mixed and mastered by the same engineering team. At -7.9 LUFS, integrated, and with short term loudness up to -5.6 LUFS, it also utilizes plenty of clipping, but in a much more transparent way.
Perhaps this just goes to show that it’s hard to know exactly what happens at which stage of the process, and we shouldn’t assign blame when a song doesn’t sound the way we would like it to.
In any event, none of this seems to have stopped Alex Warren from getting a number one spot, and staying on the chart for 35 weeks.
2. “I Never Lie” by Zach Top
Producer(s): Carson Chamberlain
Mixing: Matt Rovey
Mastering: Ken Love
Peak Position: 1
Weeks on chart: 35
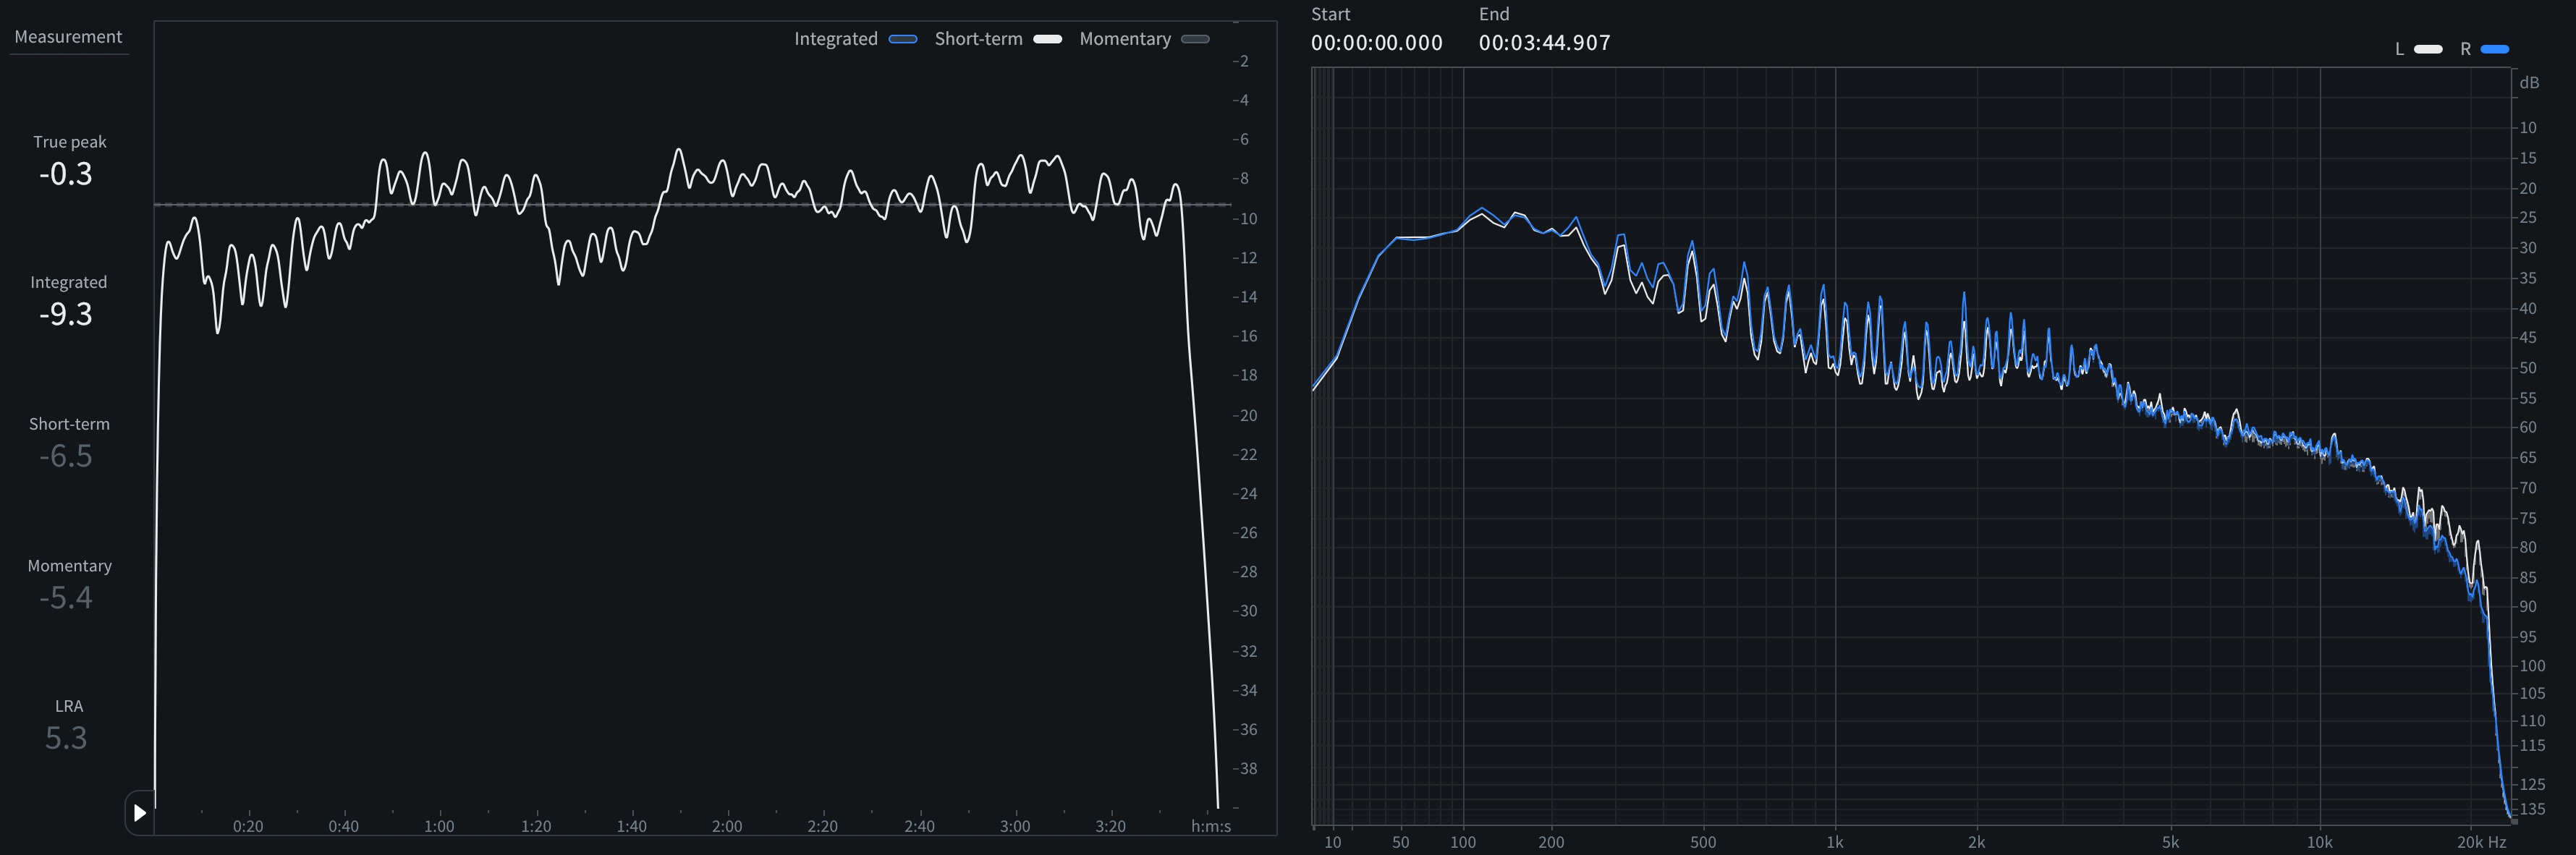
Short-term LUFS and spectrum of “I Never Lie”
True Peak: -0.33 dBTP
Sample Peak: -0.57 dBFS
Int. Loudness: -9.3 LUFS
Loudness Range: 5.3 LU
For someone who generally doesn’t love country, there’s actually a bunch I do like about this song. First of all, this sounds more authentically “country” than most of what I’ve heard in recent years, and I dig that. At -9.3 LUFS, integrated it also manages to strike a nice balance of punchiness in the verses and bridge, and a little denser and more energetic in the choruses. This leaves me with a really pleasant impression of a good band, in a great sounding space.
The one thing that jumps out at me a bit is the vocal around 3.5k. It just gets a bit strident and harsh there on the louder syllables, but it’s nothing a little mid/side dynamic EQ couldn’t help cure.
3. “you look like you love me” by Ella Langley
Producer(s): Will Bundy
Mixing: Jim Cooley
Mastering: Andrew Mendelson
Peak Position: 1
Weeks on chart: 38

Short-term LUFS and spectrum of “you look like you love me”
True Peak: 0.13 dBTP
Sample Peak: -0.10 dBFS
Int. Loudness: -8.6 LUFS
Loudness Range: 5.8 LU
For someone who claims not to be into country music that much, I sure chose an interesting chart, huh? Still, in a lot of ways this provides a nice contrast to the Zach Top song.
It’s a bit tighter and denser, more “produced” sounding than “I Never Lie,” but in a way that still works well and, again, sounds more authentically country to me than a lot of what I’ve come to expect in recent years. Interestingly, despite being a touch dark in the 7k region, it has a similar bite in the upper-midrange of the vocal – perhaps an emerging trend to go along with emerging country artists?
4. “Wanna Be Loved” by The Red Clay Strays
Producer(s): Dave Cobb
Mixing: Lee Dyess, Mark Neill
Mastering: Lee Dyess
Peak Position: 1
Weeks on chart: 69
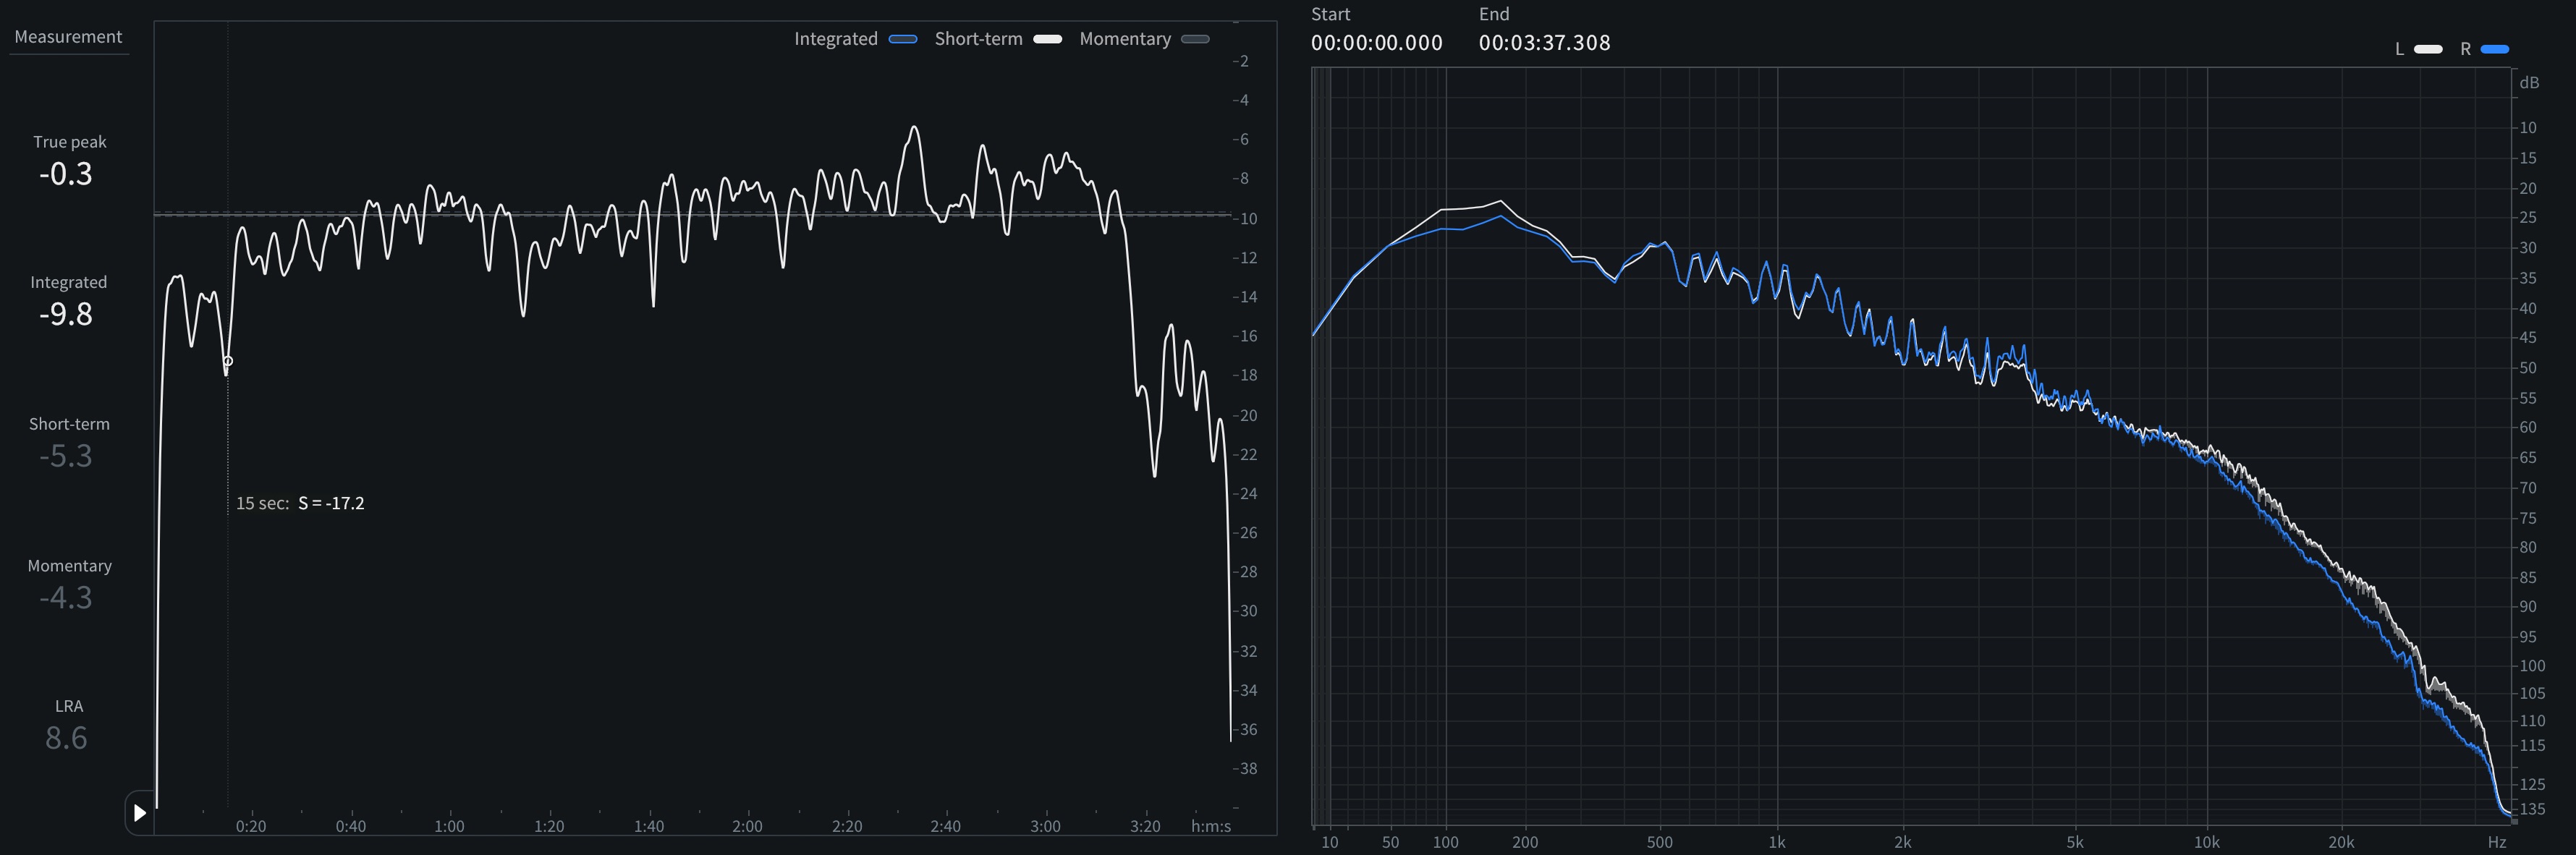
Short-term LUFS and spectrum of “Wanna Be Loved”
True Peak: -0.30 dBTP
Sample Peak: -0.40 dBFS
Int. Loudness: -9.8 LUFS
Loudness Range: 8.6 LU
There’s a lot that I really like about this mix and master – dynamically it’s punchy and open, with room to breathe; tonally it’s big and warm, with subtle and natural sounding saturation – but perhaps the highlight for me is the imaging.
When I close my eyes and listen on my mains, I can pick out exactly where every member of the band is, including some wonderful front-to-back depth. That’s not something that’s easily, or frequently achieved!
What’s more, peaking at number one, and on the chart for 72 weeks – and counting, as of this writing – this clearly demonstrates that high loudness and density simply isn’t required to be a break-out act.
5. “Wind Up Missin' You” by Tucker Wetmore
Producer(s): Chris LaCorte
Mixing: Dave Clauss
Mastering: Andrew Darby
Peak Position: 1
Weeks on chart: 55
Short-term LUFS and spectrum of “Wind Up Missin' You”
True Peak: -0.04 dBTP
Sample Peak: -0.30 dBFS
Int. Loudness: -8.5 LUFS
Loudness Range: 4.3 LU
Despite not having a much higher integrated level than “you look like you love me,” and actually having a lower maximum short term LUFS – -6.2 vs. -5.6 – this ends up feeling much more compressed, with quite a bit of that tizzy saturation that seems to be all the rage. That said, while it does feel a touch less authentic for music that comes from a predominantly live background, it does have a nice tonal balance – minus that tizzy saturation.
Speaking of imaging, check out the low-end here. The bass leans ever so slightly to the left – white trace. Is that a problem? Is it cool? Is it intentional or unintentional? I’ll let you be the judge.
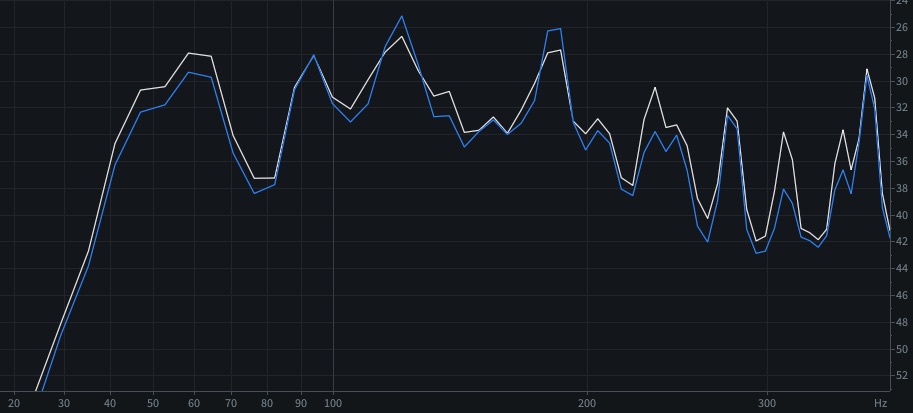
Low end stereo balance on "Wind Up Missin' You"
6. “Shake Dat Ass (Twerk Song)” by BossMan Dlow
Producer(s): Hardknock
Mixing: Cre8tive God
Mastering: Cre8tive God
Peak Position: 1
Weeks on chart: 59
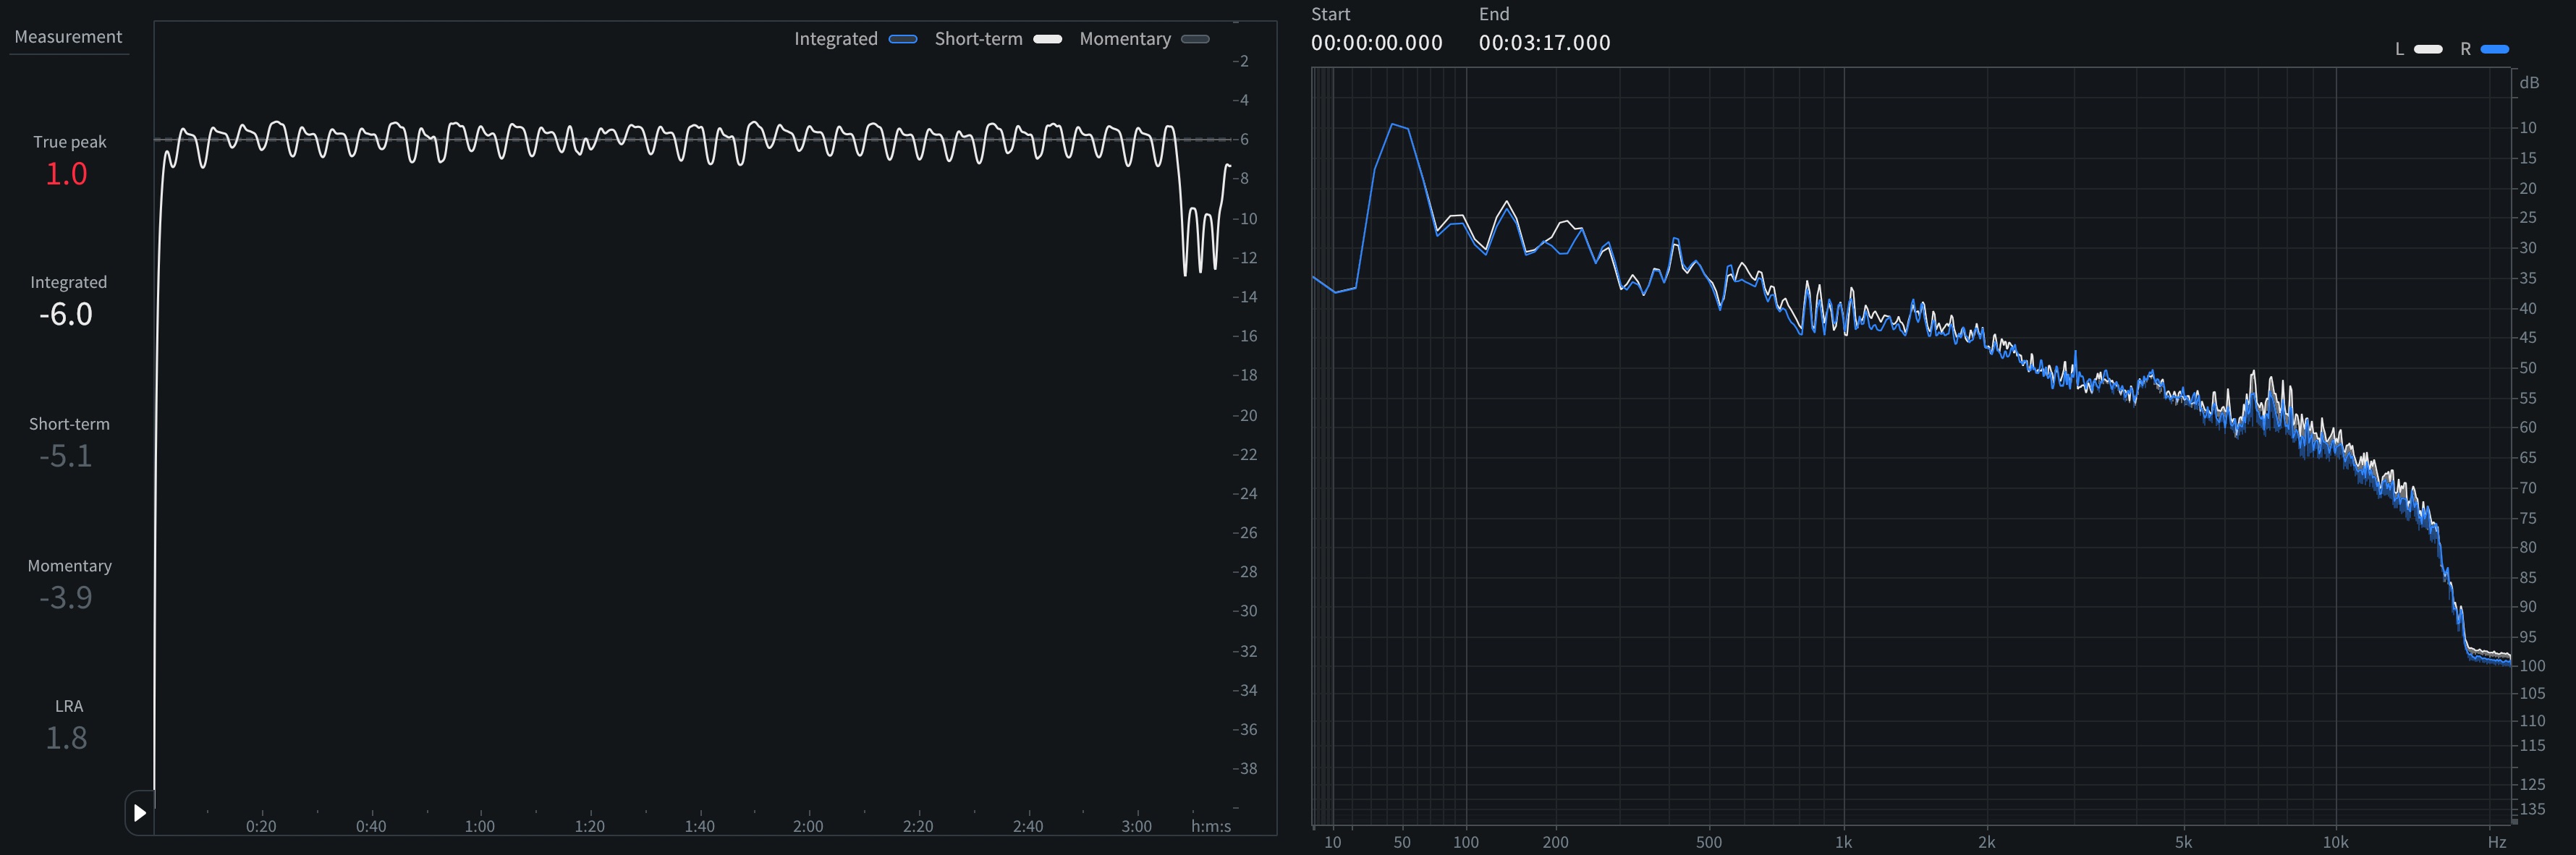
Short-term LUFS and spectrum of “Shake Dat Ass (Twerk Song)”
True Peak: 1.03 dBTP
Sample Peak: 0.00 dBFS
Int. Loudness: -6.0 LUFS
Loudness Range: 1.8 LU
In the words of Monty Python, “and now for something completely different.”
With a trunk-rattling 46 Hz 808, full-on level from the word go, and clipping on even the solo piano at the end, this is a pretty radical departure from everything else we’ve listened to. Not only that, it very much appears to be an MP3 2-track beat with a vocal on top.
How can I tell? Listen to the side channel in isolation. We can easily hear the warbly, watery sound typical of low-bitrate lossy coding. We can also look at the top of the spectrogram in RX and see the jagged top edge with frequent brick-wall cutoffs above about 15-16 kHz.

High-frequency spectrogram of "Shake Dat Ass"
So, another data point: do you need super-high production value to make it to number one on the emerging artists chart, and stay on the chart for over a year? It would seem not so. If the vibe of your song resonates or finds its niche, that’s all it takes.
7. “Subwoofer Lullaby” by C418
Producer(s): C418
Mixing: C418
Mastering: C418
Peak Position: 1
Weeks on chart: 35
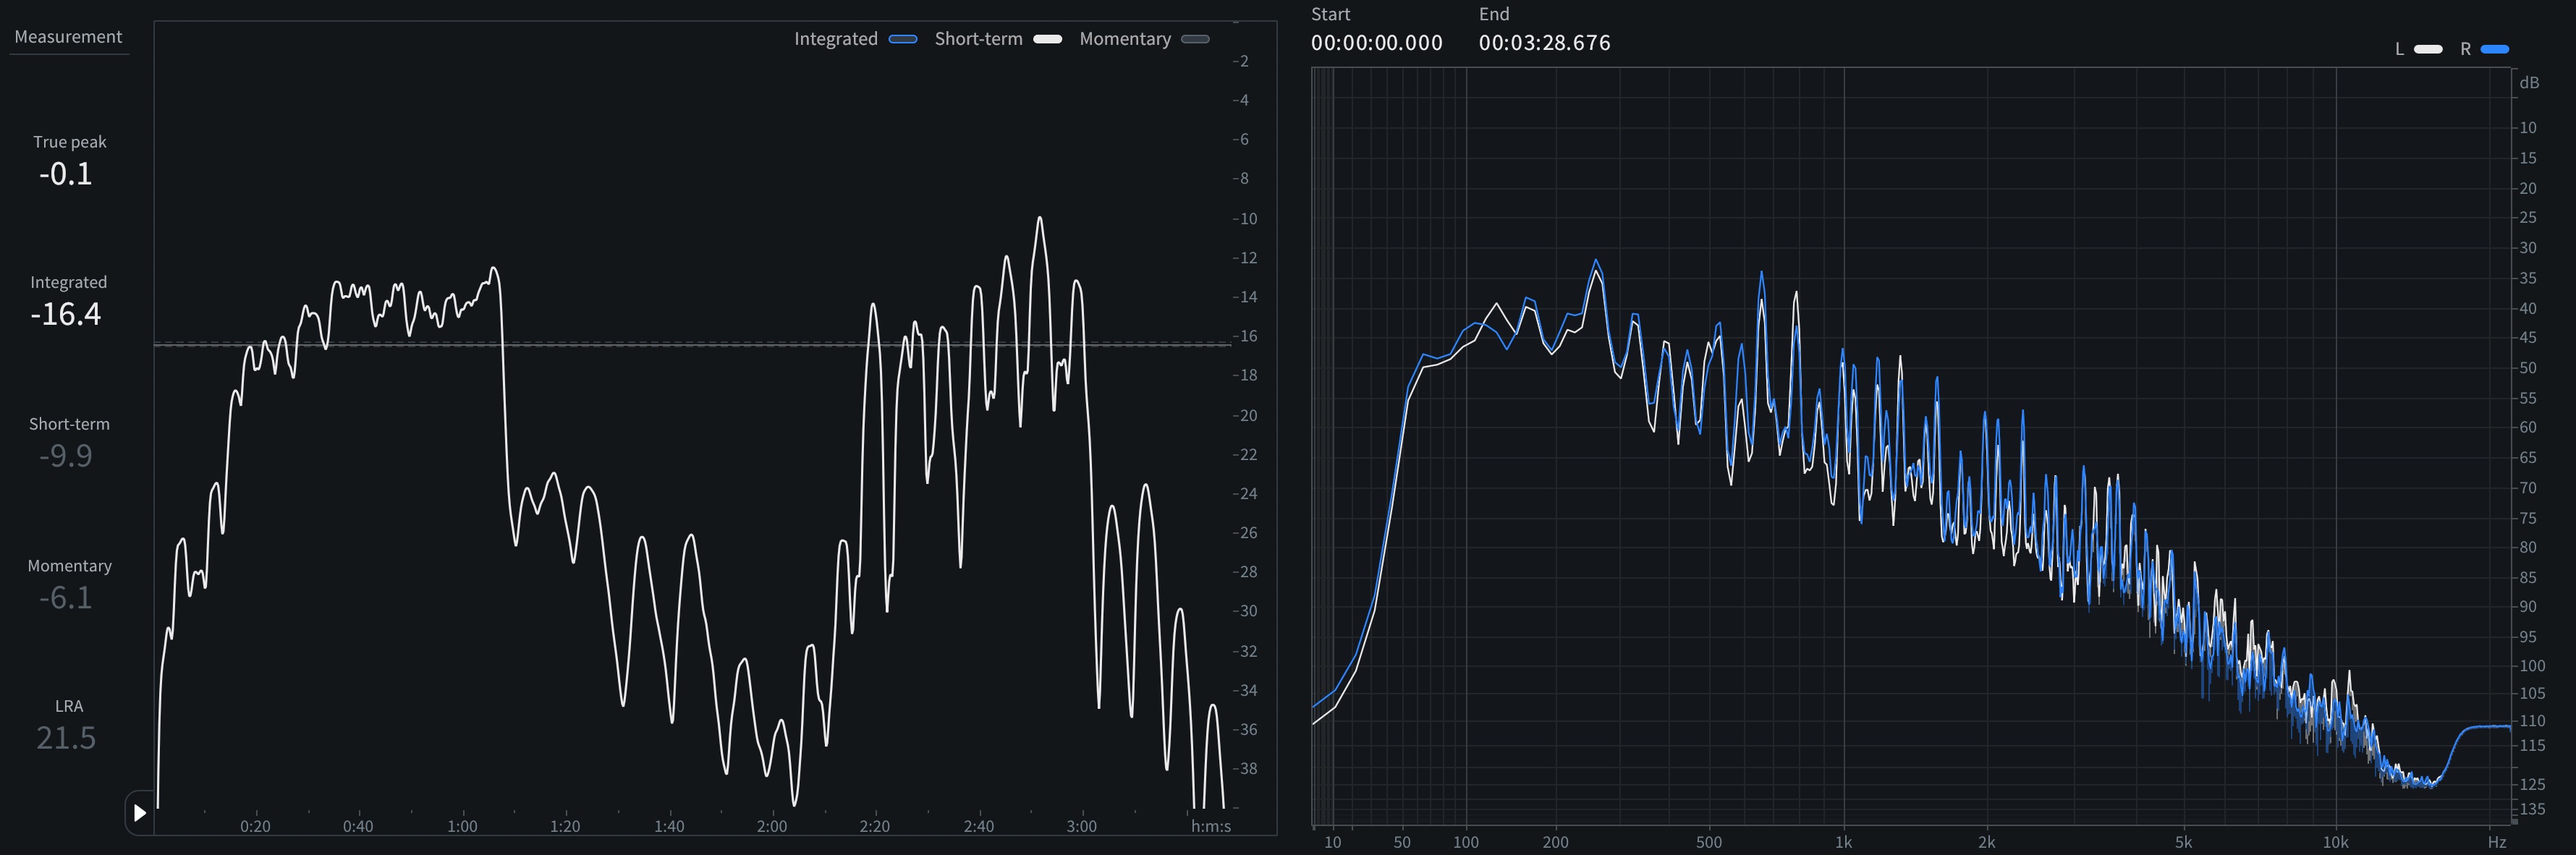
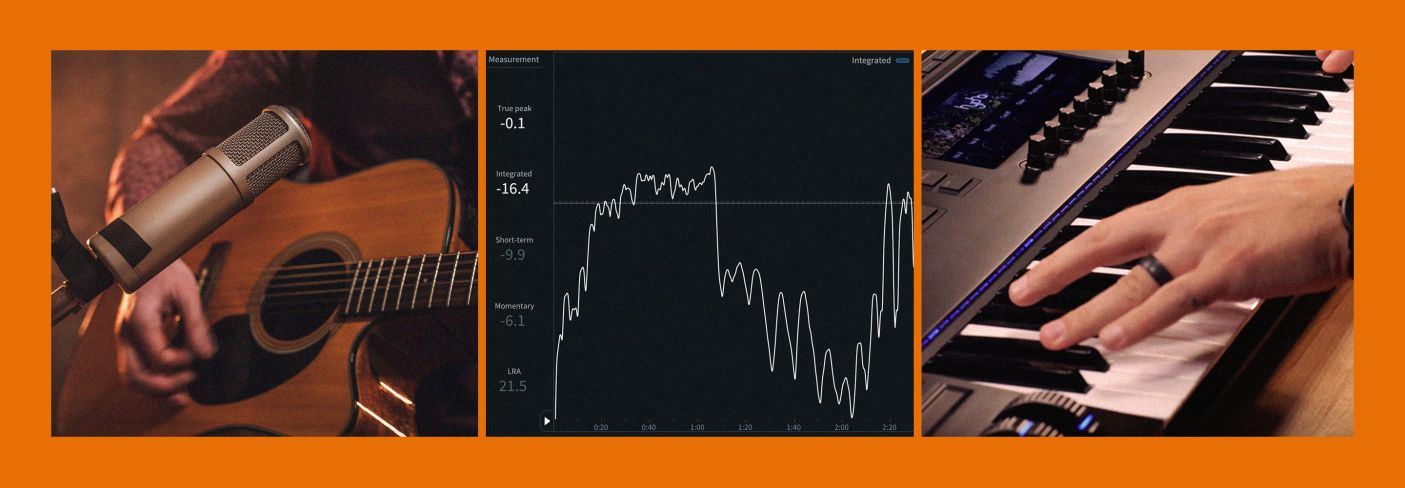
Short-term LUFS and spectrum of “Subwoofer Lullaby”
True Peak: -0.08 dBTP
Sample Peak: -0.10 dBFS
Int. Loudness: -16.4 LUFS
Loudness Range: 21.5 LU
Here we have another really interesting one, although what makes it interesting isn’t what you might initially expect.
How does the composer of predominantly ambient music for Minecraft, originally released in 2011, make it to the top of the emerging artists chart 12 years later, and then pop in and out of that chart for another 2 years, with the most current stretch at 38 weeks, and climbing 13 spots in the last week alone? I’m certainly not sure I know.
Billboard’s own analysis points to new vinyl pressings of “Minecraft: Volume Alpha” in July of 2023, but can that really still account for the success of what seems on the surface to be such a niche outlier? Mysteries abound...
8. “Magnetic” by ILLIT
Producer(s): Slow Rabbit, Bang Si Hyuk, Martin
Mixing: Kevin Grainger
Mastering: Chris Gehringer
Peak Position: 1
Weeks on chart: 35
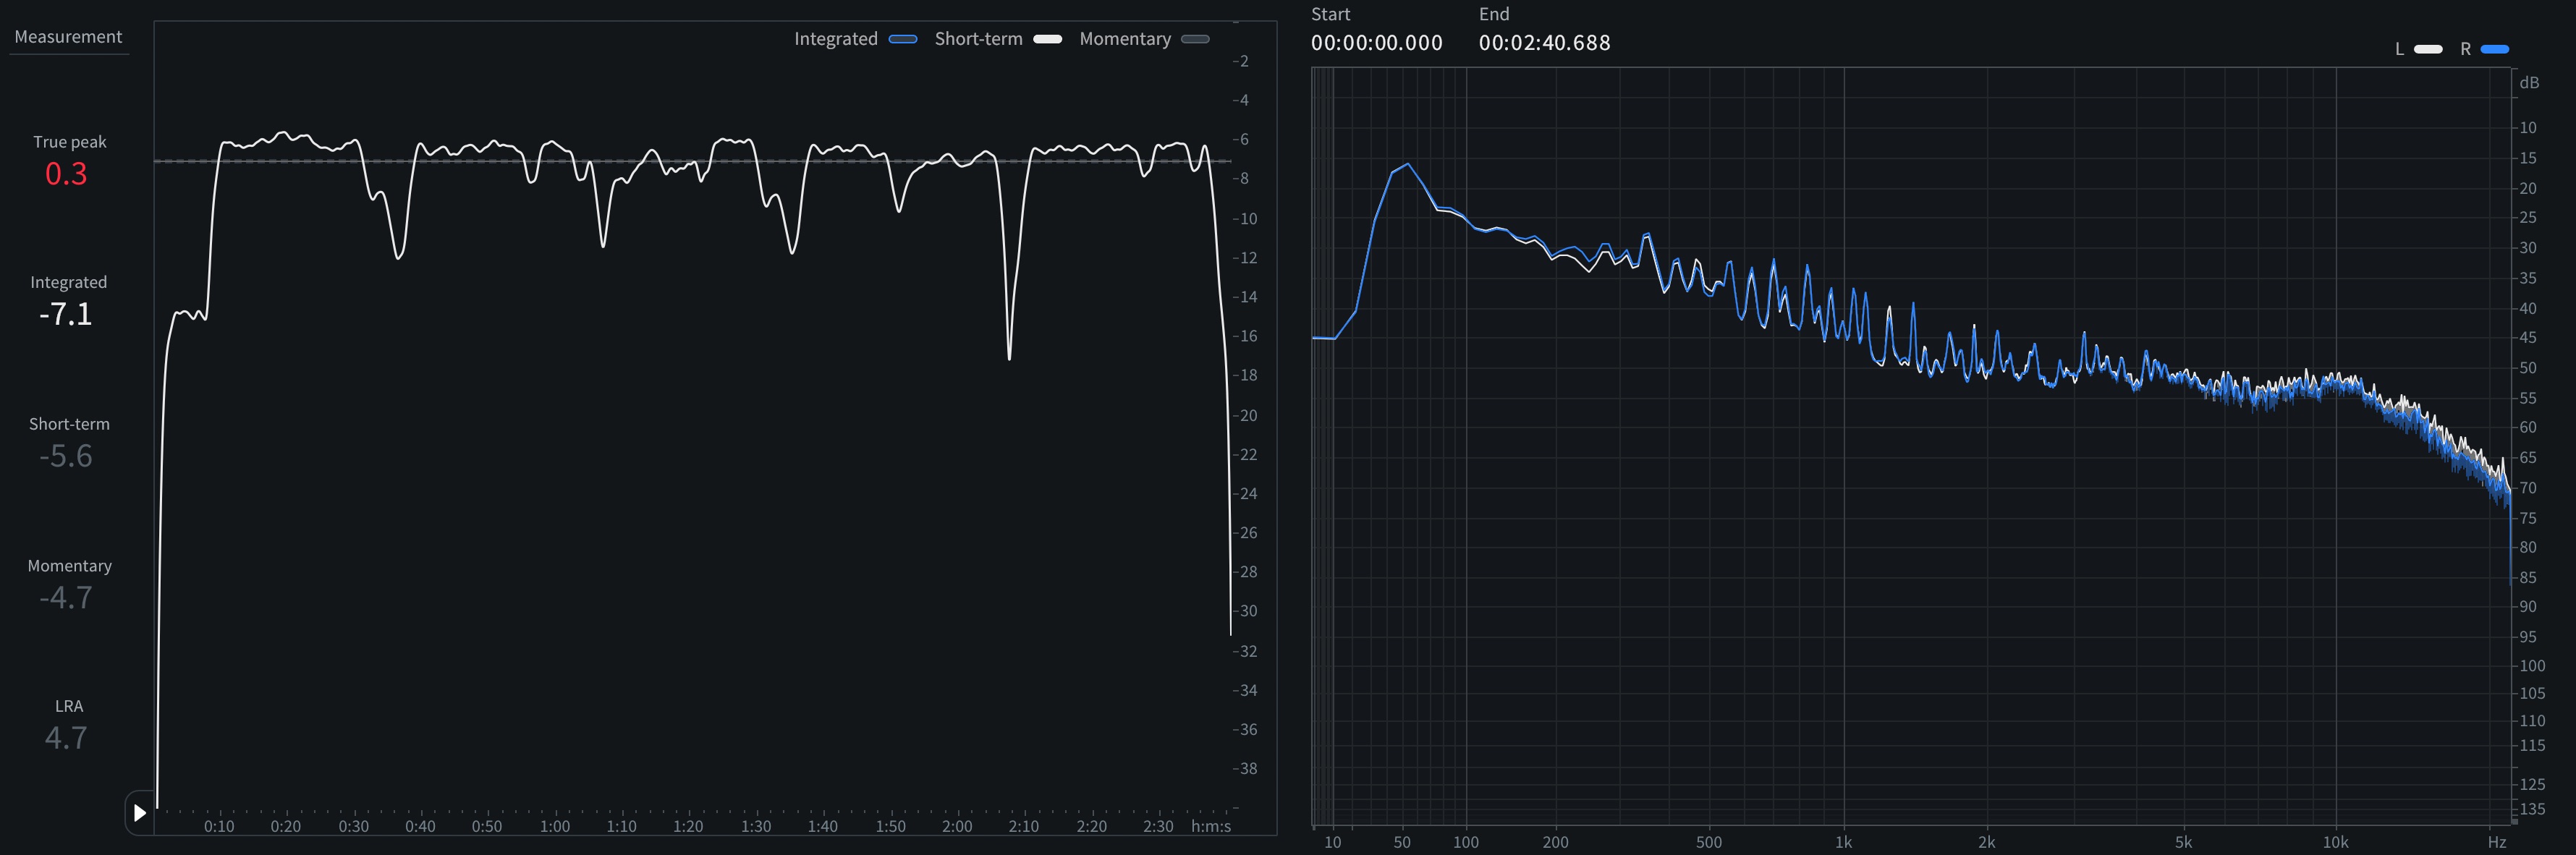
Short-term LUFS and spectrum of “Magnetic”
True Peak: 0.29 dBTP
Sample Peak: -0.19 dBFS
Int. Loudness: -7.1 LUFS
Loudness Range: 4.7 LU
We’ve heard a few songs mastered by Randy Merrill in our recent analyses, but now it’s time to check one out from his next-door neighbor, Chris Gehringer. Literally, Chris and Randy have adjacent rooms at the world-class Sterling Mastering facility.
In my recent article on top-charting dance and electronic songs I talked about the idea of “good and loud,” and this certainly falls in that category. It also stands up really well to being played loud – where loudness really counts. Full, glossy, and with a big – and wide – low end, it stays shy of ever getting harsh or clearly distorting.
Whether or not you’re into K-Pop, this is a great sounding reference for any sort of adjacent genres.
9. “A Lot More Free” by Max McNown
Producer(s): Steve Fee
Mixing: Jack Nellis
Mastering: Sam Moses
Peak Position: 1
Weeks on chart: 30
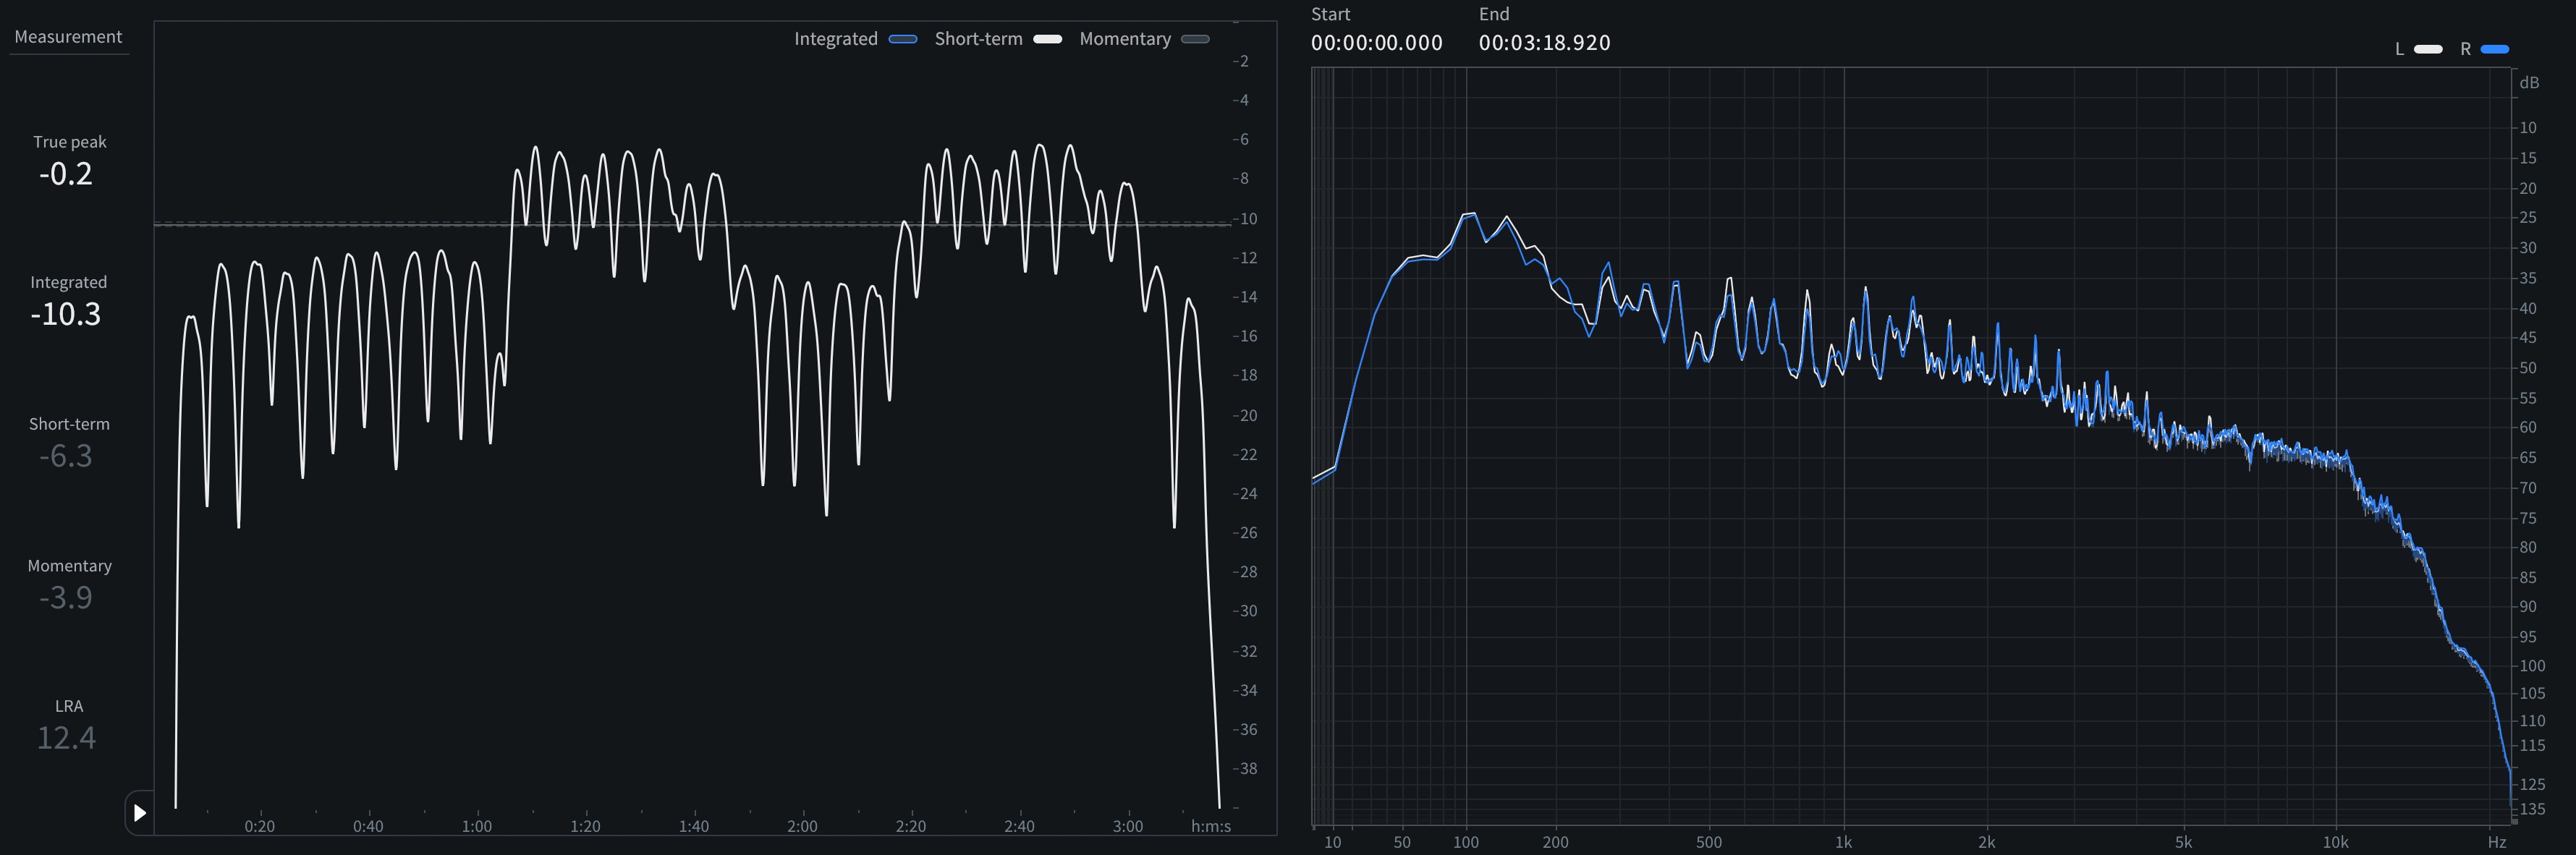
Short-term LUFS and spectrum of “A Lot More Free”
True Peak: -0.17 dBTP
Sample Peak: -0.20 dBFS
Int. Loudness: -10.3 LUFS
Loudness Range: 12.4 LU
Rounding us out on this journey is “A Lot More Free” by Max McKnown, a nice closer. It’s a pretty song that I think sounds great in the verses, but in my humble opinion the choruses serve to illustrate why we have to be a bit careful with macrodynamics in mixing and certainly mastering. My impression is that the choruses are meant to sound massive after the solo guitar and voice verses, but it ends up feeling a bit restrained and held back due to the dynamics processing.
Again, we can’t know for certain whether this happened in mixing or mastering, but in both cases I think it’s important to listen to the biggest moments in your mix and make sure they have the impact they deserve.
Meta-analysis and reflection
So, what have we learned here today? I would say if anything we’ve seen that loudness, and even production value, don’t have a strong correlation with having a breakout success. Looking at some averages from this chart compared to our longer-running trends we see that if anything, integrated levels are a bit lower – although still within our standard deviation.
| 2024 Trends | Chart/Award | |
| Avg LUFS, Int | -8.3, ±1 | -9.2 |
| Max LUFS, Int | -6.0 | -6.0 |
| Min LUFS, Int | -11.1 | -16.4 |
| Avg LUFS, S-T | -6.1, ±0.99 | -6.0 |
| Max LUFS, S-T | -3.6 | -3.3 |
| Min LUFS, S-T | -7.8 | -10.0 |
| Avg LRA | 5.5, ±1.5 | 8.2 |
| Max LRA | 10.8 | 21.5 |
| Min LRA | 1.4 | 1.8 |
Also, the country genre remains ever-popular, and is maybe seeing a bit of a return to its roots – something I, for one, welcome!
So that’s it for today, but keep an eye out for more analyses down the road, and be sure to let us know over on Instagram if there are any particular charts, genres, or songs you’d like to see analyzed.
Start analyzing your audio with RX, the industry-standard audio repair and editing software.